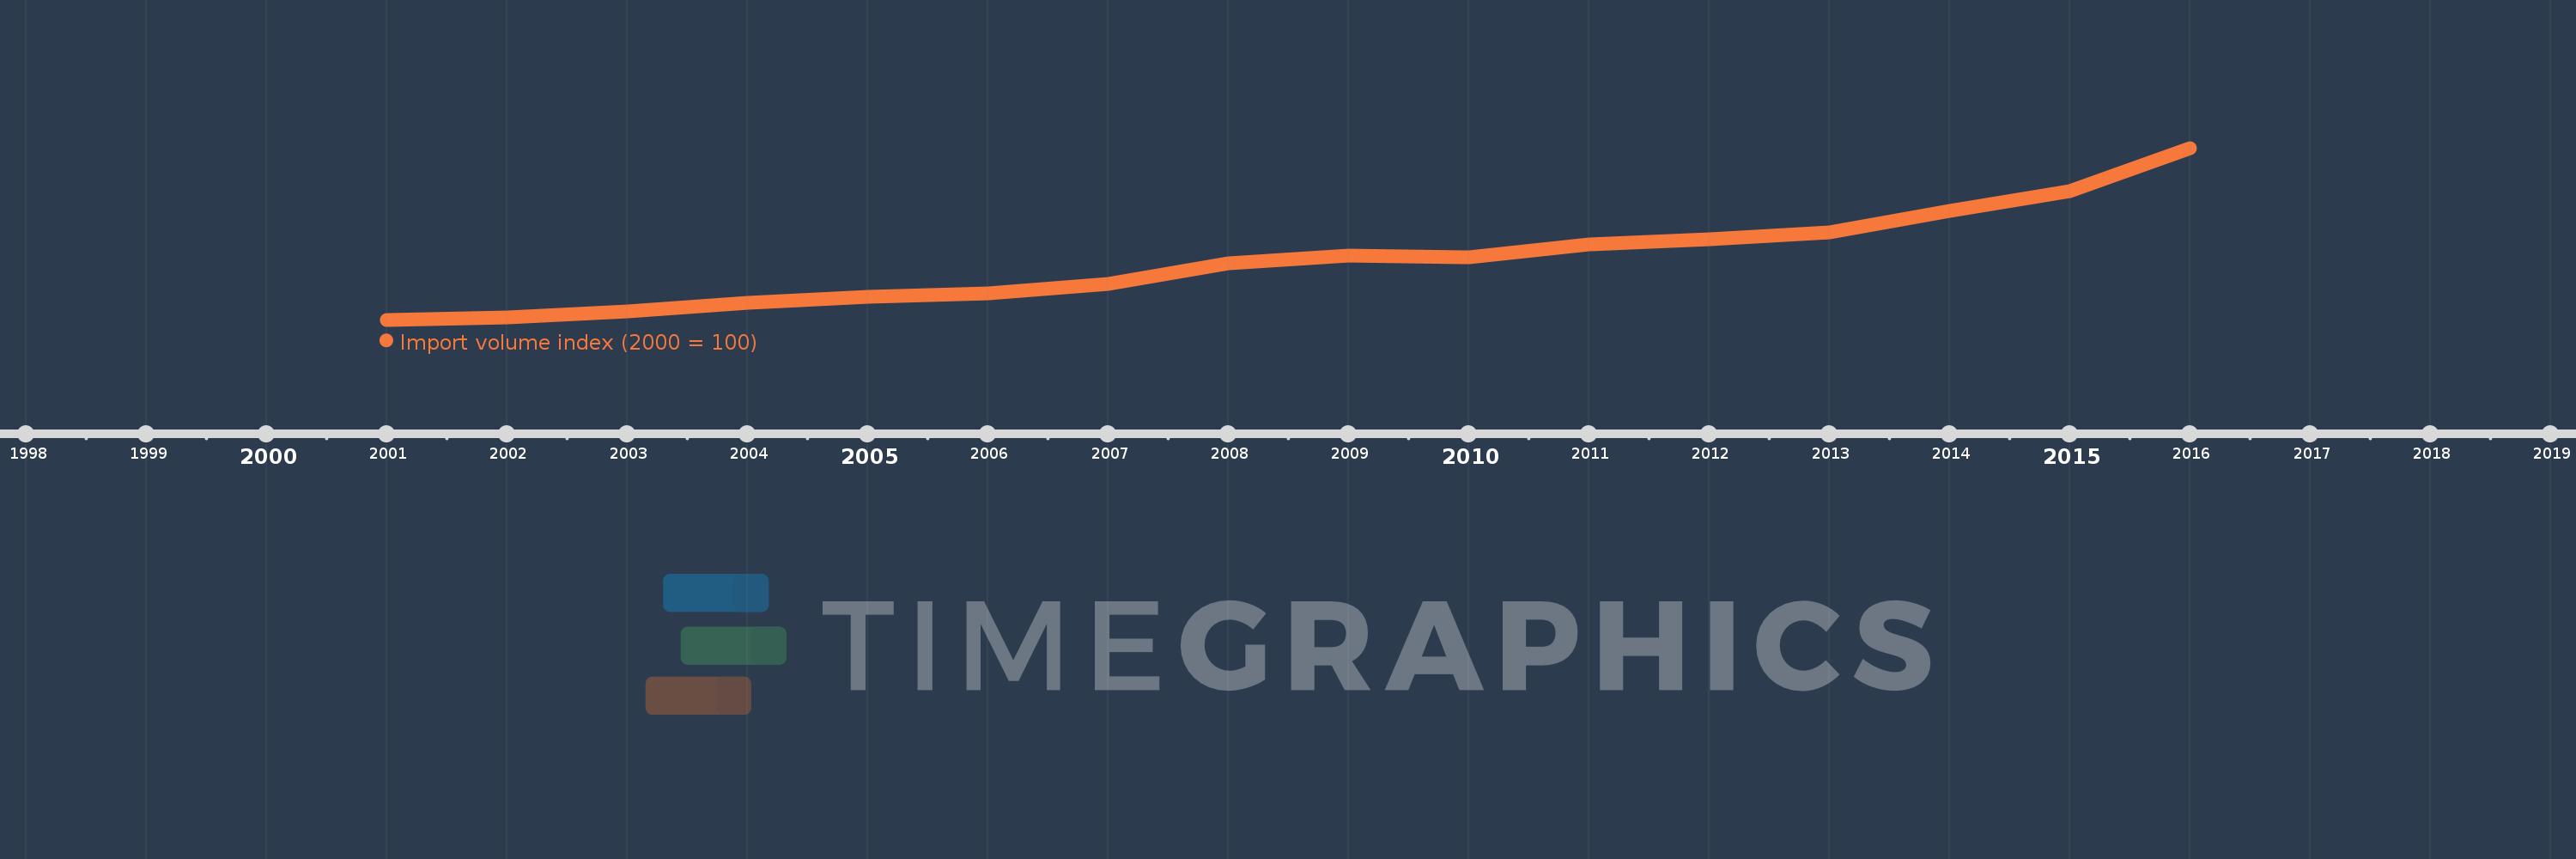
This timeline shows a graph from 2001 to 2016 of Vietnam. No data until 2000. Number of actual observations by date: 16.
Source name:
World Development Indicators
Source organization:
United Nations Conference on Trade and Development, Handbook of Statistics and data files, and International Monetary Fund, International Financial Statistics.
Categories, topics:
Private Sector, Trade
Last updated:
apr 23, 2017
Indicators value changes by year
Meaning:
323.467
Minimum:
100.0
jan 1, 2001
Maximum:
747.686
jan 1, 2016
At the date of observation
Value
Absolute change
Change from the previous value
jan 1, 2001
100.0
+100.0
0.0%
jan 1, 2002
107.918
+7.918
7.92%
jan 1, 2003
131.525
+23.608
21.88%
jan 1, 2004
162.694
+31.168
23.7%
jan 1, 2005
187.899
+25.206
15.49%
jan 1, 2006
200.432
+12.533
6.67%
jan 1, 2007
236.448
+36.016
17.97%
jan 1, 2008
313.274
+76.826
32.49%
jan 1, 2009
341.279
+28.004
8.94%
jan 1, 2010
334.573
-6.706
-1.96%
jan 1, 2011
384.273
+49.7
14.85%
jan 1, 2012
402.262
+17.989
4.68%
jan 1, 2013
430.045
+27.783
6.91%
jan 1, 2014
511.303
+81.257
18.9%
jan 1, 2015
583.86
+72.557
14.19%
jan 1, 2016
747.686
+163.826
28.06%
Ranking of countries by current statistics by years