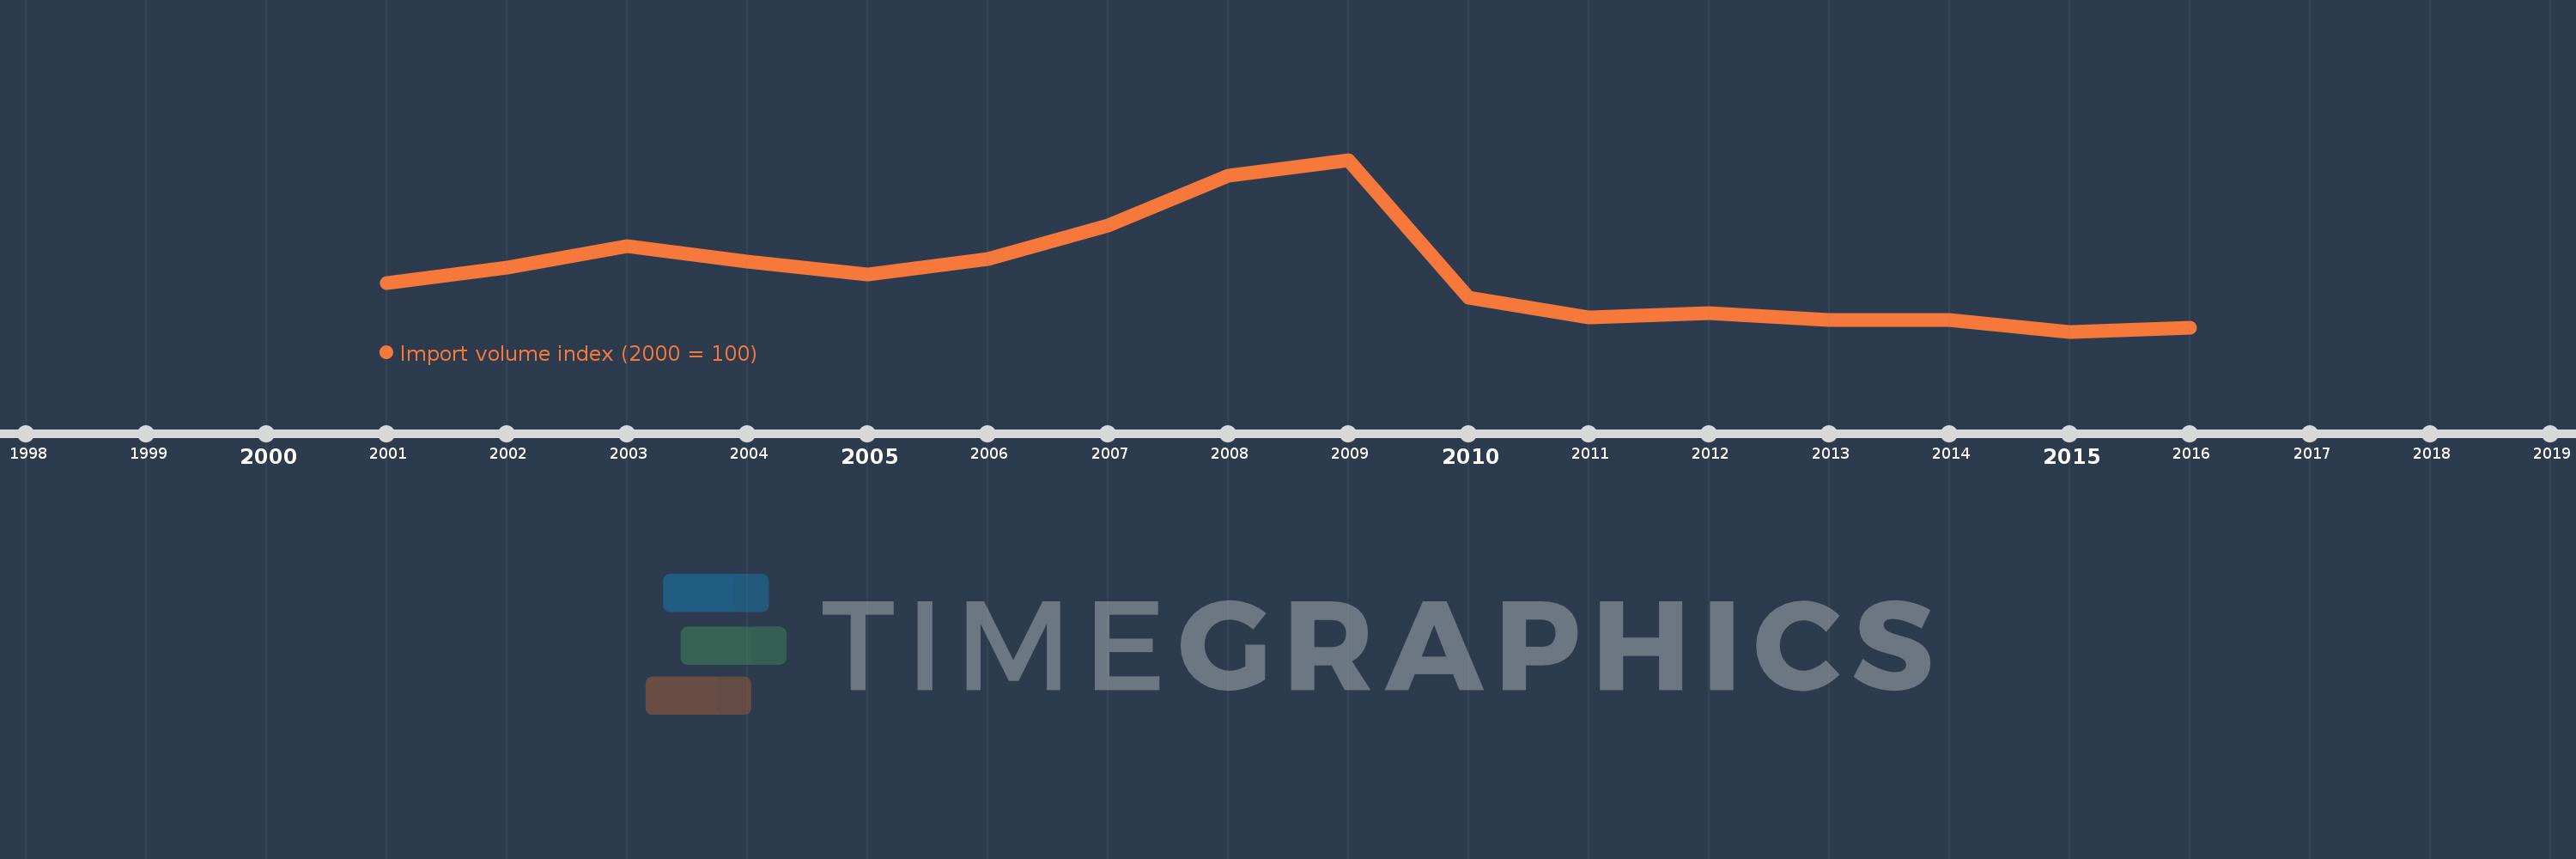
This timeline shows a graph from 2001 to 2016 of Jamaica. No data until 2000. Number of actual observations by date: 16.
Source name:
World Development Indicators
Source organization:
United Nations Conference on Trade and Development, Handbook of Statistics and data files, and International Monetary Fund, International Financial Statistics.
Categories, topics:
Private Sector, Trade
Last updated:
apr 23, 2017
Indicators value changes by year
Meaning:
102.9
Minimum:
85.593
jan 1, 2015
Maximum:
137.033
jan 1, 2009
At the date of observation
Value
Absolute change
Change from the previous value
jan 1, 2001
100.0
+100.0
0.0%
jan 1, 2002
104.73
+4.73
4.73%
jan 1, 2003
111.163
+6.433
6.14%
jan 1, 2004
106.451
-4.712
-4.24%
jan 1, 2005
102.664
-3.787
-3.56%
jan 1, 2006
107.392
+4.728
4.61%
jan 1, 2007
117.31
+9.919
9.24%
jan 1, 2008
132.304
+14.994
12.78%
jan 1, 2009
137.033
+4.729
3.57%
jan 1, 2010
95.88
-41.153
-30.03%
jan 1, 2011
89.744
-6.136
-6.4%
jan 1, 2012
91.211
+1.467
1.63%
jan 1, 2013
89.12
-2.091
-2.29%
jan 1, 2014
89.141
+0.02
0.02%
jan 1, 2015
85.593
-3.547
-3.98%
jan 1, 2016
86.67
+1.077
1.26%
Ranking of countries by current statistics by years