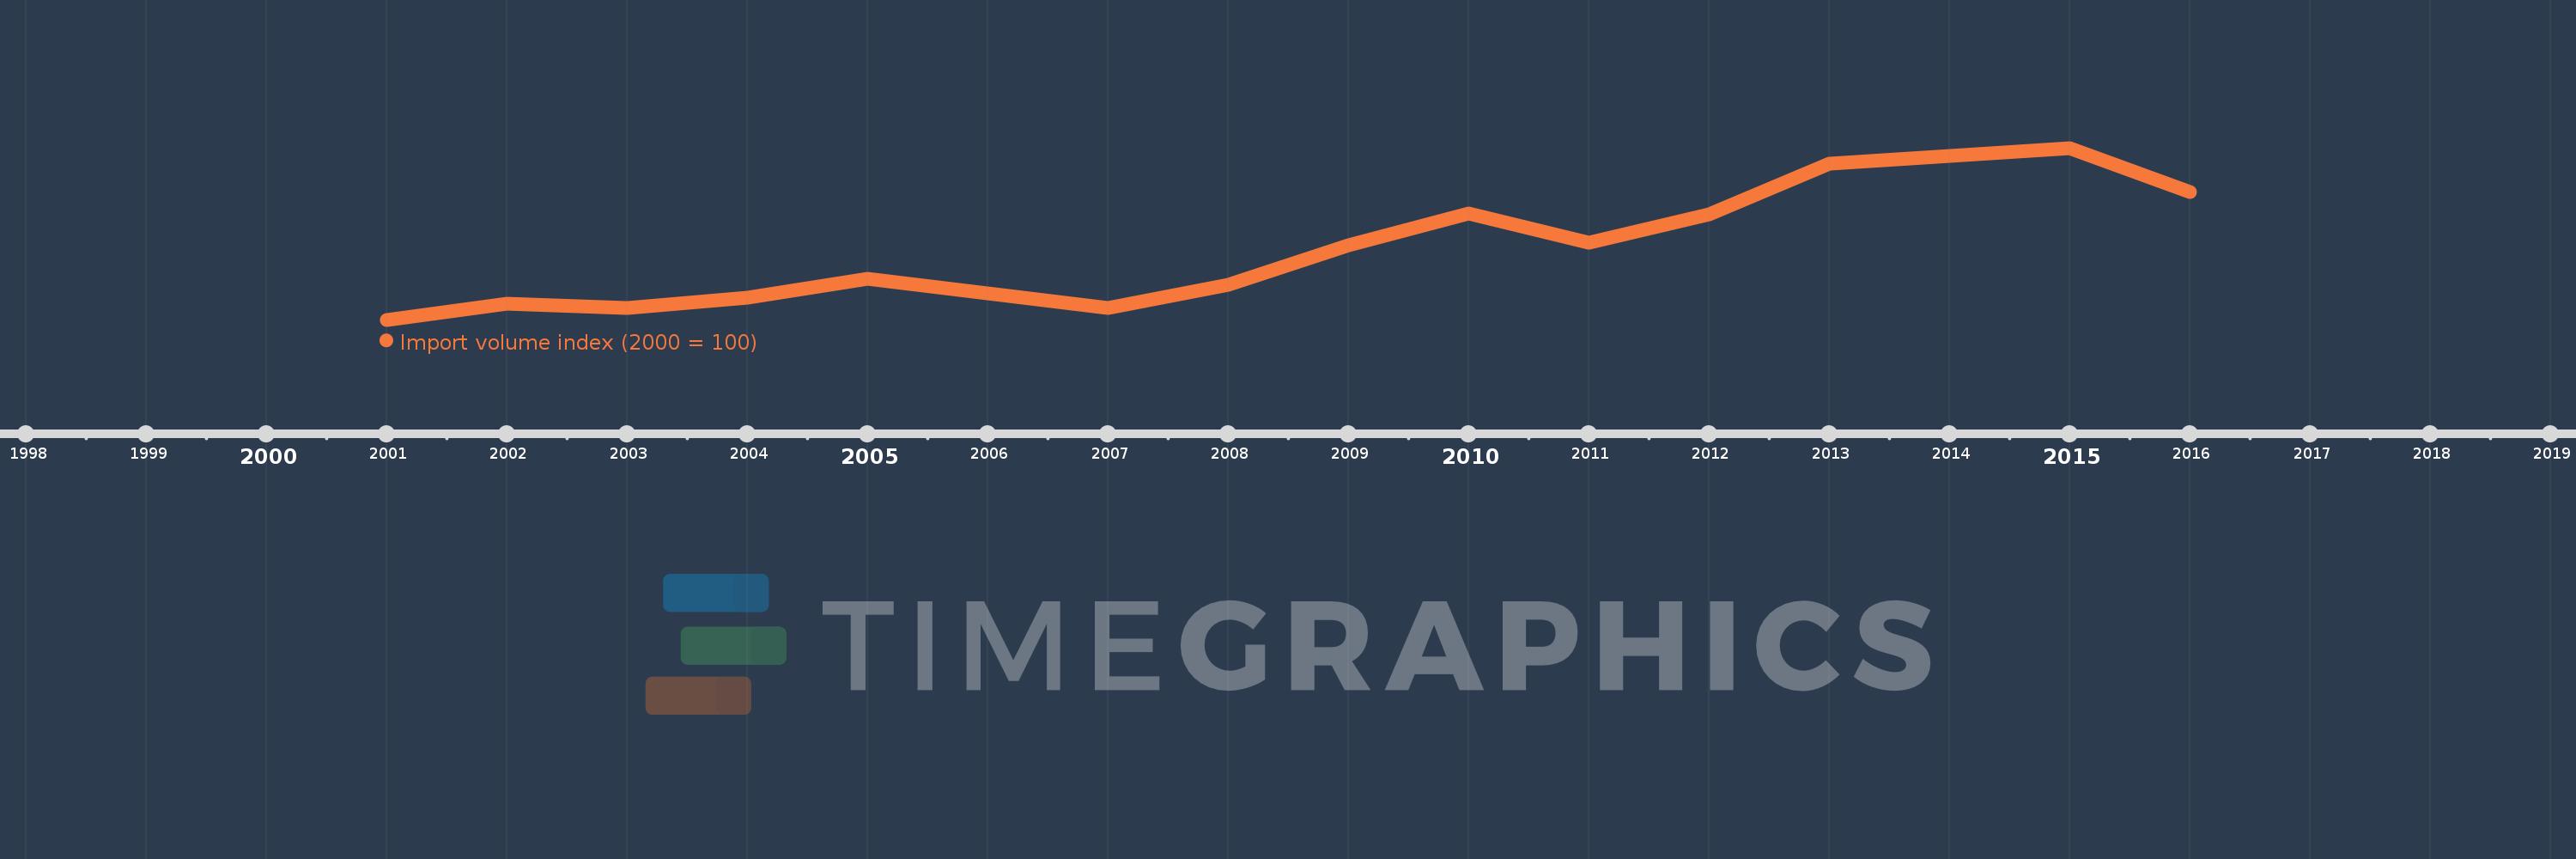
This timeline shows a graph from 2001 to 2016 of Turkmenistan. No data until 2000. Number of actual observations by date: 16.
Source name:
World Development Indicators
Source organization:
United Nations Conference on Trade and Development, Handbook of Statistics and data files, and International Monetary Fund, International Financial Statistics.
Categories, topics:
Private Sector, Trade
Last updated:
apr 23, 2017
Indicators value changes by year
Meaning:
219.09
Minimum:
100.0
jan 1, 2001
Maximum:
385.532
jan 1, 2015
At the date of observation
Value
Absolute change
Change from the previous value
jan 1, 2001
100.0
+100.0
0.0%
jan 1, 2002
126.91
+26.91
26.91%
jan 1, 2003
120.097
-6.813
-5.37%
jan 1, 2004
136.017
+15.92
13.26%
jan 1, 2005
167.477
+31.46
23.13%
jan 1, 2006
144.138
-23.339
-13.94%
jan 1, 2007
120.266
-23.872
-16.56%
jan 1, 2008
157.851
+37.585
31.25%
jan 1, 2009
224.111
+66.259
41.98%
jan 1, 2010
276.001
+51.89
23.15%
jan 1, 2011
228.172
-47.829
-17.33%
jan 1, 2012
274.667
+46.496
20.38%
jan 1, 2013
358.979
+84.311
30.7%
jan 1, 2014
372.63
+13.652
3.8%
jan 1, 2015
385.532
+12.902
3.46%
jan 1, 2016
312.593
-72.939
-18.92%
Ranking of countries by current statistics by years