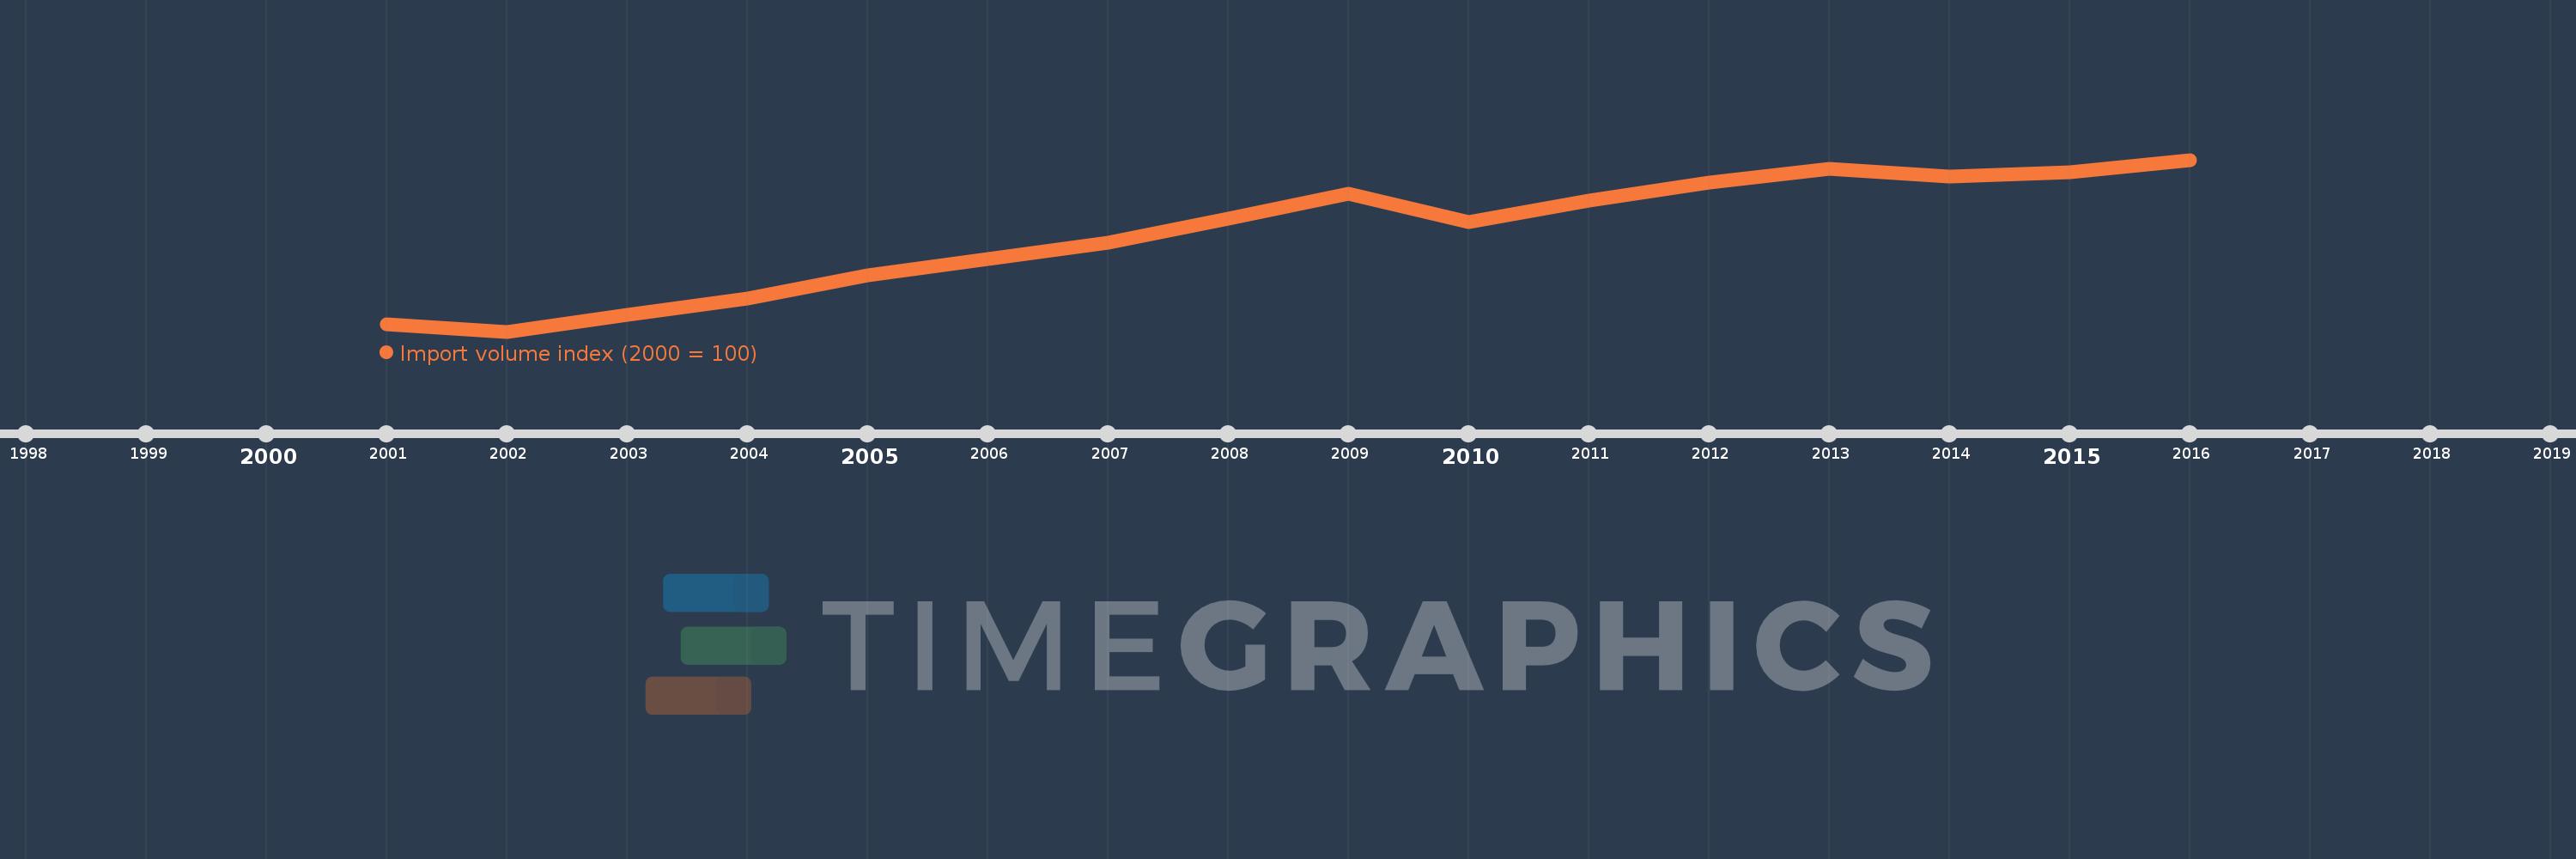
This timeline shows a graph from 2001 to 2016 of Australia. No data until 2000. Number of actual observations by date: 16.
Source name:
World Development Indicators
Source organization:
United Nations Conference on Trade and Development, Handbook of Statistics and data files, and International Monetary Fund, International Financial Statistics.
Categories, topics:
Private Sector, Trade
Last updated:
apr 23, 2017
Indicators value changes by year
Meaning:
169.375
Minimum:
94.686
jan 1, 2002
Maximum:
226.006
jan 1, 2016
At the date of observation
Value
Absolute change
Change from the previous value
jan 1, 2001
100.0
+100.0
0.0%
jan 1, 2002
94.686
-5.314
-5.31%
jan 1, 2003
107.539
+12.853
13.57%
jan 1, 2004
120.03
+12.491
11.62%
jan 1, 2005
137.586
+17.556
14.63%
jan 1, 2006
150.149
+12.563
9.13%
jan 1, 2007
162.551
+12.402
8.26%
jan 1, 2008
180.883
+18.332
11.28%
jan 1, 2009
200.371
+19.488
10.77%
jan 1, 2010
178.138
-22.234
-11.1%
jan 1, 2011
195.008
+16.87
9.47%
jan 1, 2012
208.476
+13.468
6.91%
jan 1, 2013
219.103
+10.627
5.1%
jan 1, 2014
213.163
-5.94
-2.71%
jan 1, 2015
216.306
+3.142
1.47%
jan 1, 2016
226.006
+9.7
4.48%
Ranking of countries by current statistics by years