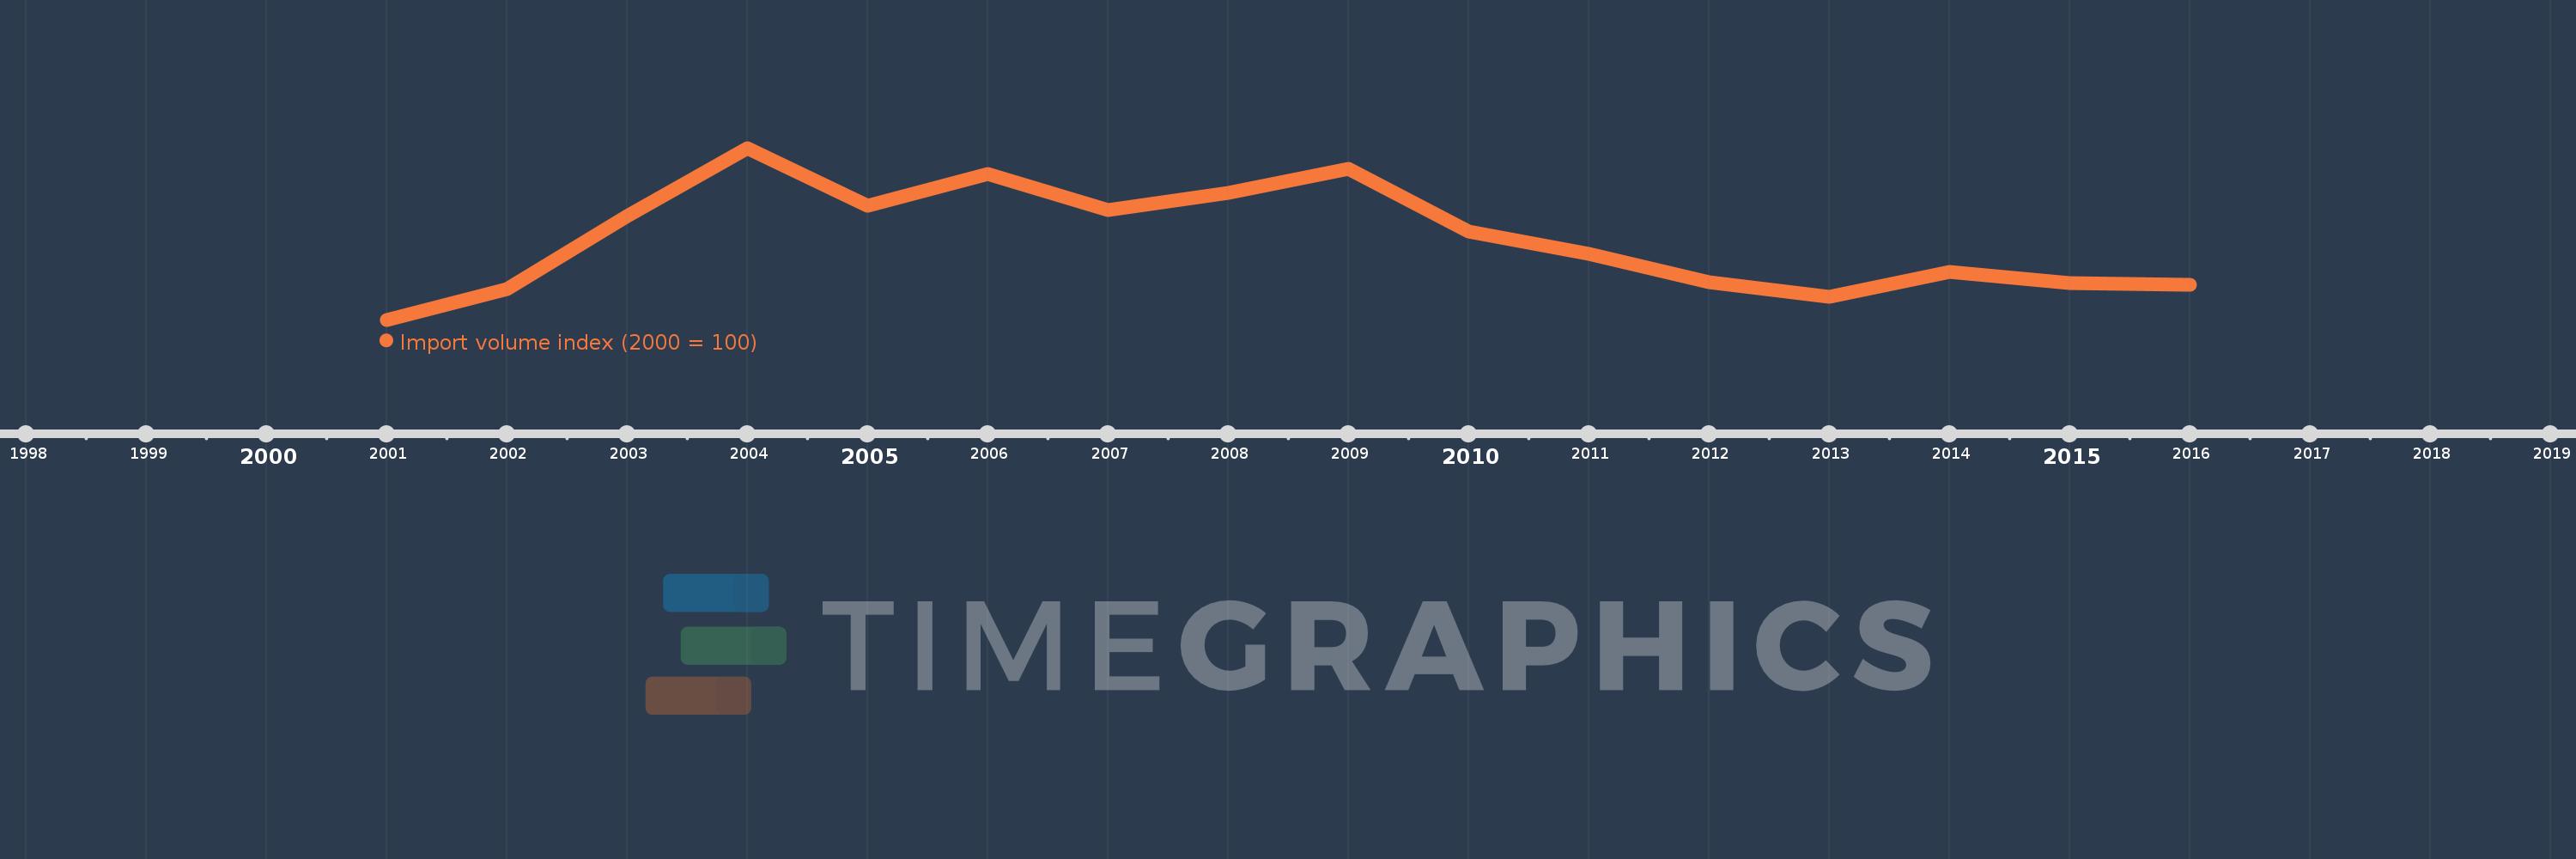
This timeline shows a graph from 2001 to 2016 of French Polynesia. No data until 2000. Number of actual observations by date: 16.
Source name:
World Development Indicators
Source organization:
United Nations Conference on Trade and Development, Handbook of Statistics and data files, and International Monetary Fund, International Financial Statistics.
Categories, topics:
Private Sector, Trade
Last updated:
apr 23, 2017
Indicators value changes by year
Meaning:
127.695
Minimum:
100.0
jan 1, 2001
Maximum:
159.095
jan 1, 2004
At the date of observation
Value
Absolute change
Change from the previous value
jan 1, 2001
100.0
+100.0
0.0%
jan 1, 2002
110.603
+10.603
10.6%
jan 1, 2003
135.547
+24.944
22.55%
jan 1, 2004
159.095
+23.548
17.37%
jan 1, 2005
139.112
-19.983
-12.56%
jan 1, 2006
150.253
+11.141
8.01%
jan 1, 2007
137.758
-12.495
-8.32%
jan 1, 2008
143.534
+5.776
4.19%
jan 1, 2009
151.869
+8.335
5.81%
jan 1, 2010
130.464
-21.405
-14.09%
jan 1, 2011
122.558
-7.906
-6.06%
jan 1, 2012
112.947
-9.612
-7.84%
jan 1, 2013
108.019
-4.927
-4.36%
jan 1, 2014
116.489
+8.47
7.84%
jan 1, 2015
112.711
-3.778
-3.24%
jan 1, 2016
112.161
-0.55
-0.49%
Ranking of countries by current statistics by years