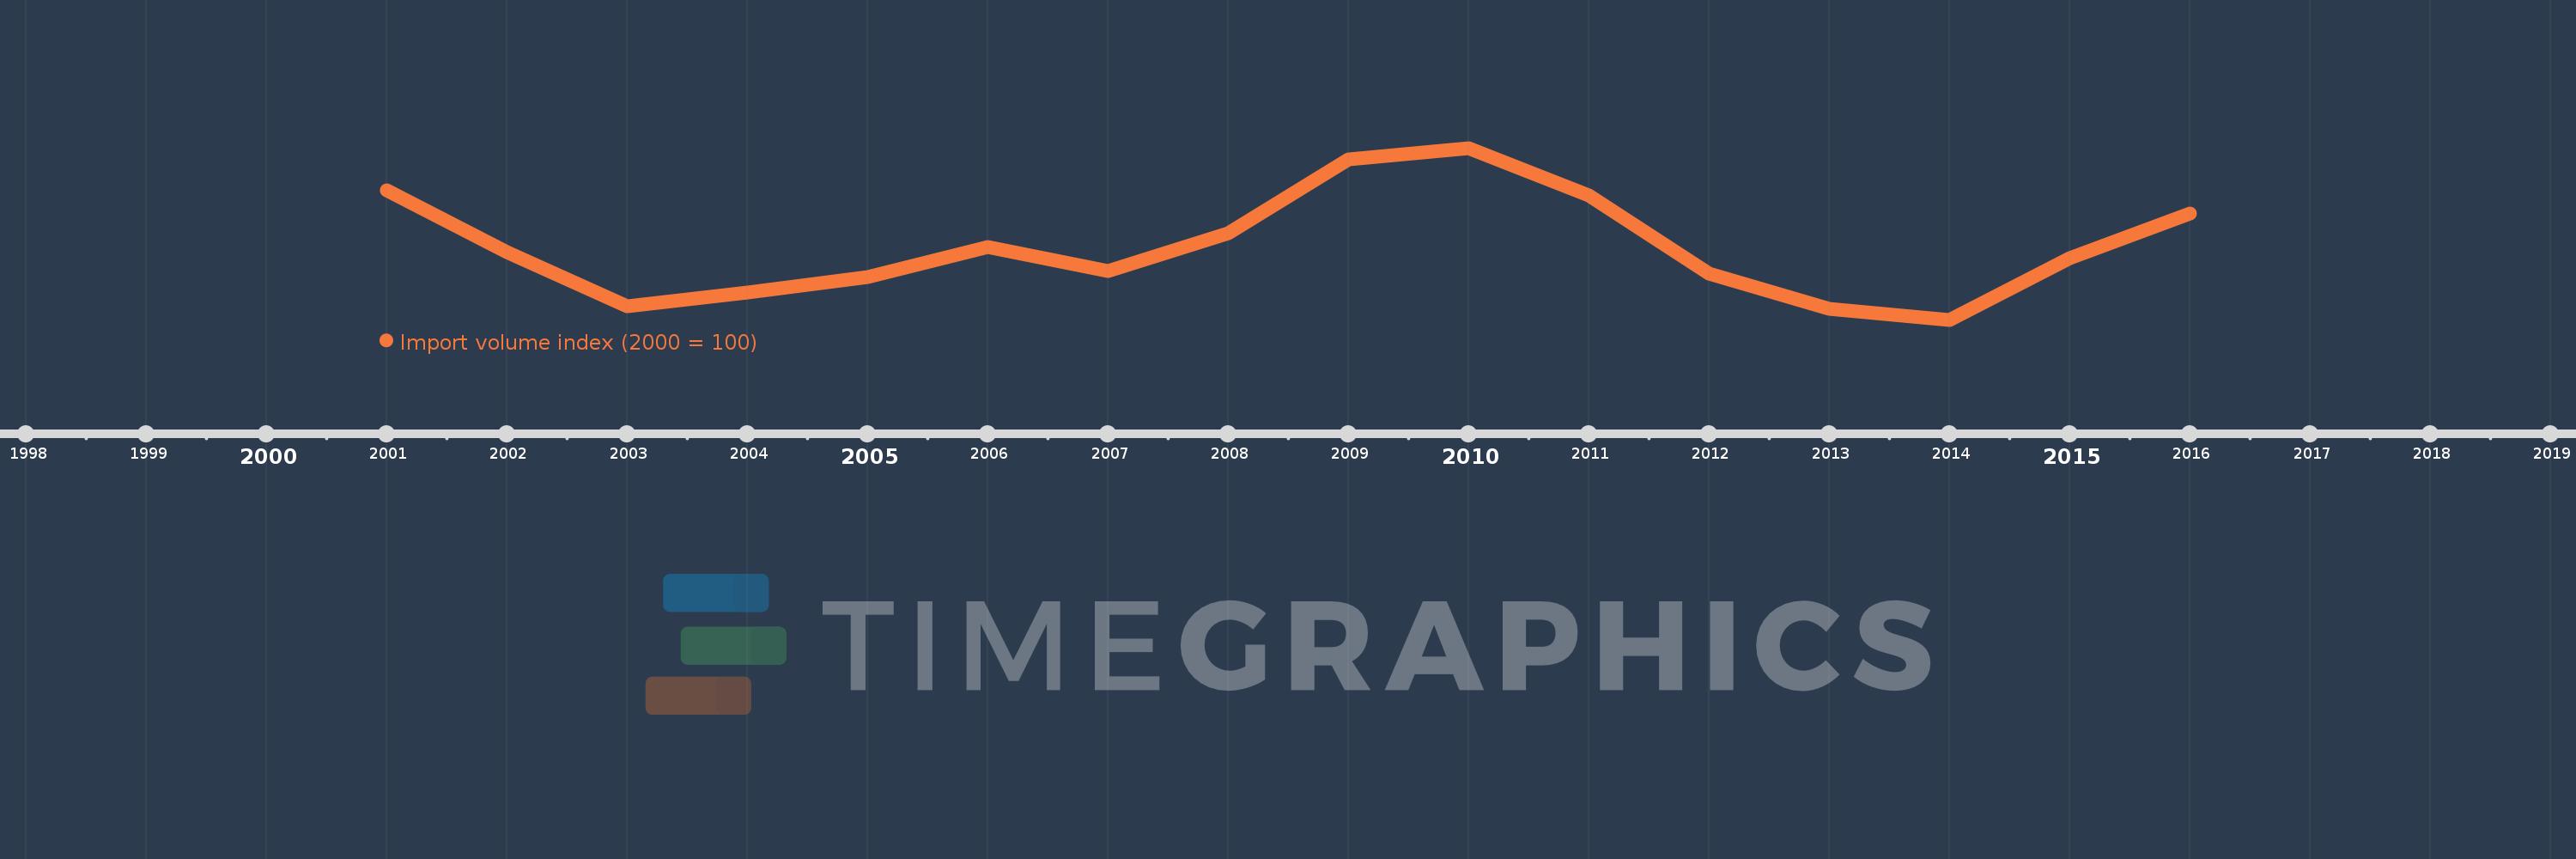
This timeline shows a graph from 2001 to 2016 of Dominica. No data until 2000. Number of actual observations by date: 16.
Source name:
World Development Indicators
Source organization:
United Nations Conference on Trade and Development, Handbook of Statistics and data files, and International Monetary Fund, International Financial Statistics.
Categories, topics:
Private Sector, Trade
Last updated:
apr 23, 2017
Indicators value changes by year
Meaning:
90.431
Minimum:
78.061
jan 1, 2014
Maximum:
107.114
jan 1, 2010
At the date of observation
Value
Absolute change
Change from the previous value
jan 1, 2001
100.0
+100.0
0.0%
jan 1, 2002
89.544
-10.456
-10.46%
jan 1, 2003
80.307
-9.236
-10.31%
jan 1, 2004
82.719
+2.412
3.0%
jan 1, 2005
85.286
+2.568
3.1%
jan 1, 2006
90.361
+5.075
5.95%
jan 1, 2007
86.262
-4.099
-4.54%
jan 1, 2008
92.686
+6.424
7.45%
jan 1, 2009
105.239
+12.554
13.54%
jan 1, 2010
107.114
+1.875
1.78%
jan 1, 2011
99.051
-8.064
-7.53%
jan 1, 2012
85.794
-13.256
-13.38%
jan 1, 2013
79.856
-5.938
-6.92%
jan 1, 2014
78.061
-1.795
-2.25%
jan 1, 2015
88.534
+10.473
13.42%
jan 1, 2016
96.075
+7.541
8.52%
Ranking of countries by current statistics by years