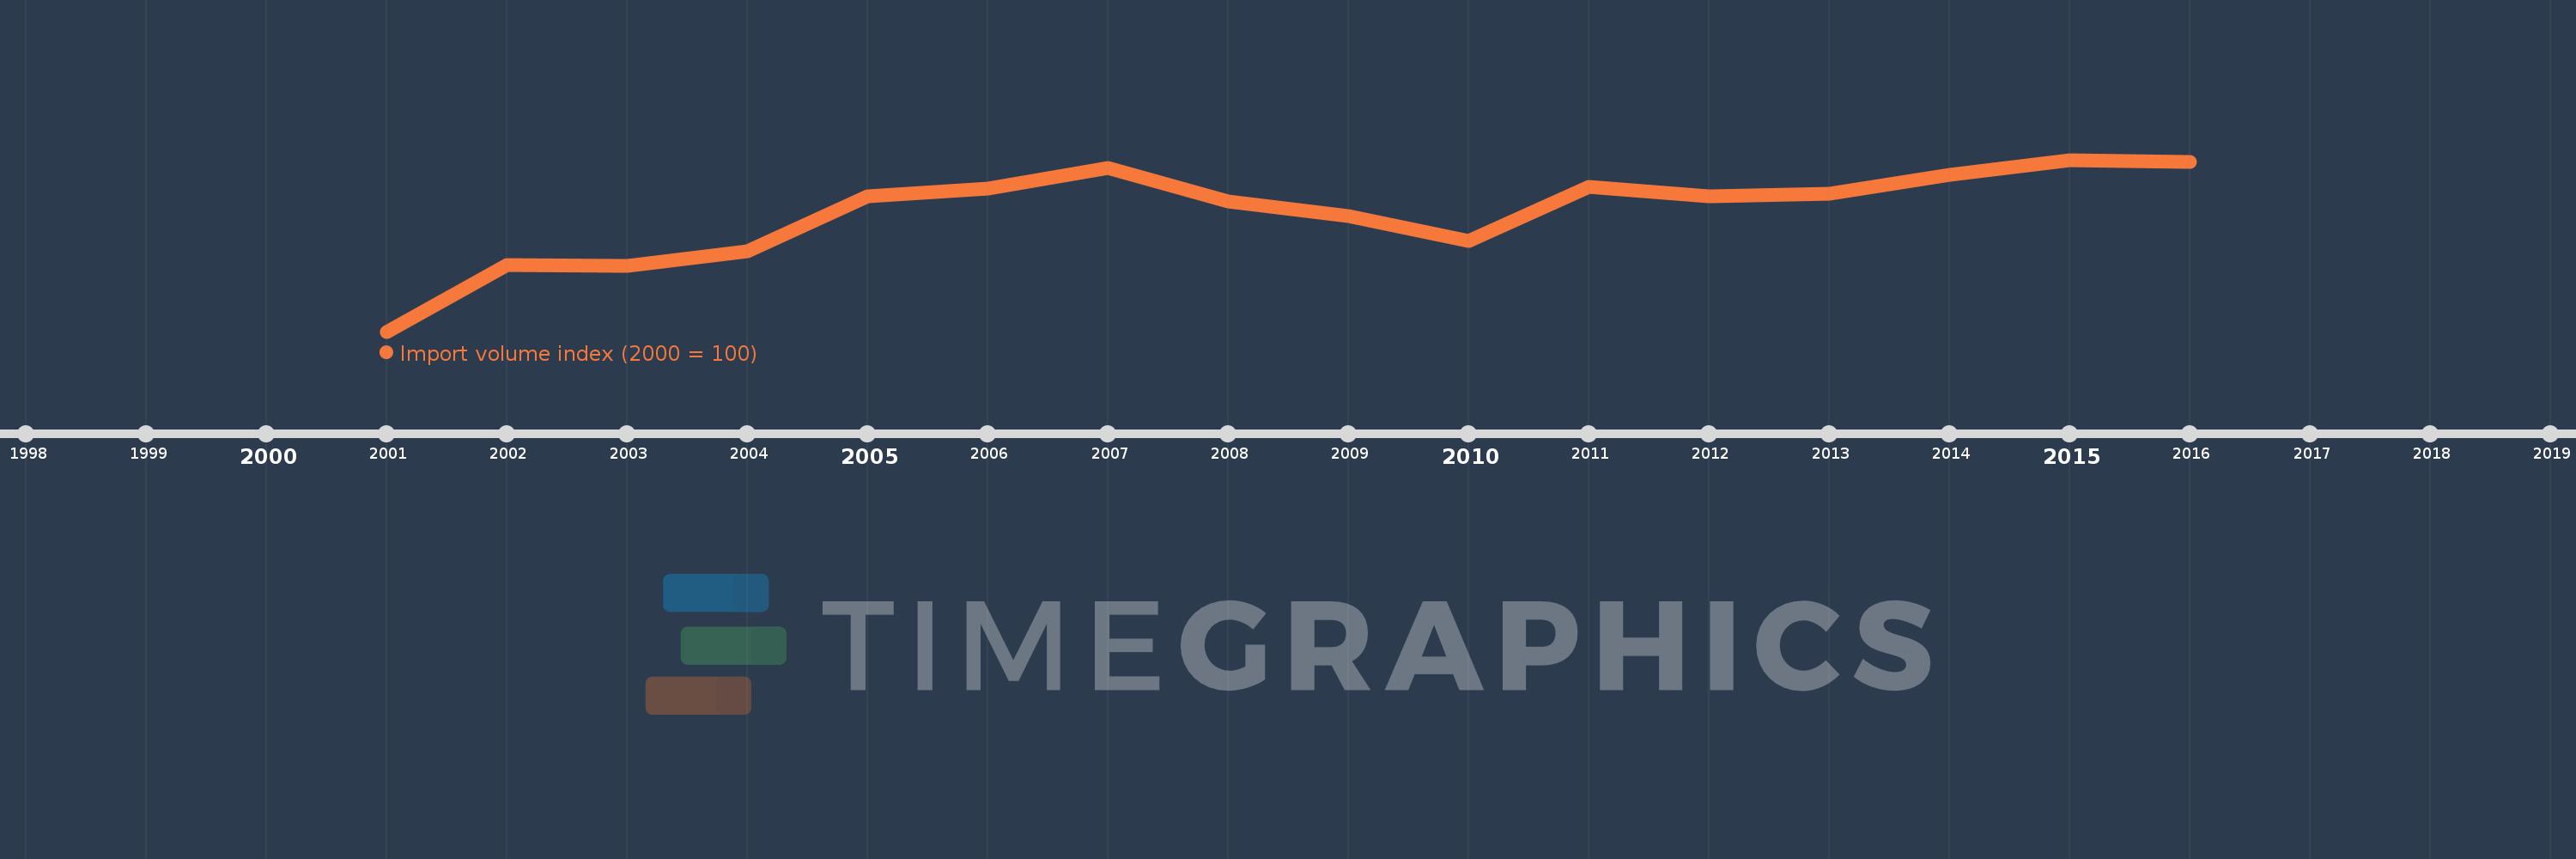
This timeline shows a graph from 2001 to 2016 of Samoa. No data until 2000. Number of actual observations by date: 16.
Source name:
World Development Indicators
Source organization:
United Nations Conference on Trade and Development, Handbook of Statistics and data files, and International Monetary Fund, International Financial Statistics.
Categories, topics:
Private Sector, Trade
Last updated:
apr 23, 2017
Indicators value changes by year
Meaning:
192.552
Minimum:
100.0
jan 1, 2001
Maximum:
233.319
jan 1, 2015
At the date of observation
Value
Absolute change
Change from the previous value
jan 1, 2001
100.0
+100.0
0.0%
jan 1, 2002
151.871
+51.871
51.87%
jan 1, 2003
151.225
-0.646
-0.43%
jan 1, 2004
162.592
+11.367
7.52%
jan 1, 2005
204.818
+42.226
25.97%
jan 1, 2006
210.712
+5.893
2.88%
jan 1, 2007
227.235
+16.523
7.84%
jan 1, 2008
200.864
-26.371
-11.61%
jan 1, 2009
189.877
-10.987
-5.47%
jan 1, 2010
170.589
-19.288
-10.16%
jan 1, 2011
212.055
+41.466
24.31%
jan 1, 2012
205.301
-6.754
-3.18%
jan 1, 2013
207.226
+1.925
0.94%
jan 1, 2014
221.624
+14.398
6.95%
jan 1, 2015
233.319
+11.695
5.28%
jan 1, 2016
231.519
-1.799
-0.77%
Ranking of countries by current statistics by years