This timeline shows a graph from 2009 to 2016 of Serbia. No data until 2008. Number of actual observations by date: 8.
Source name:
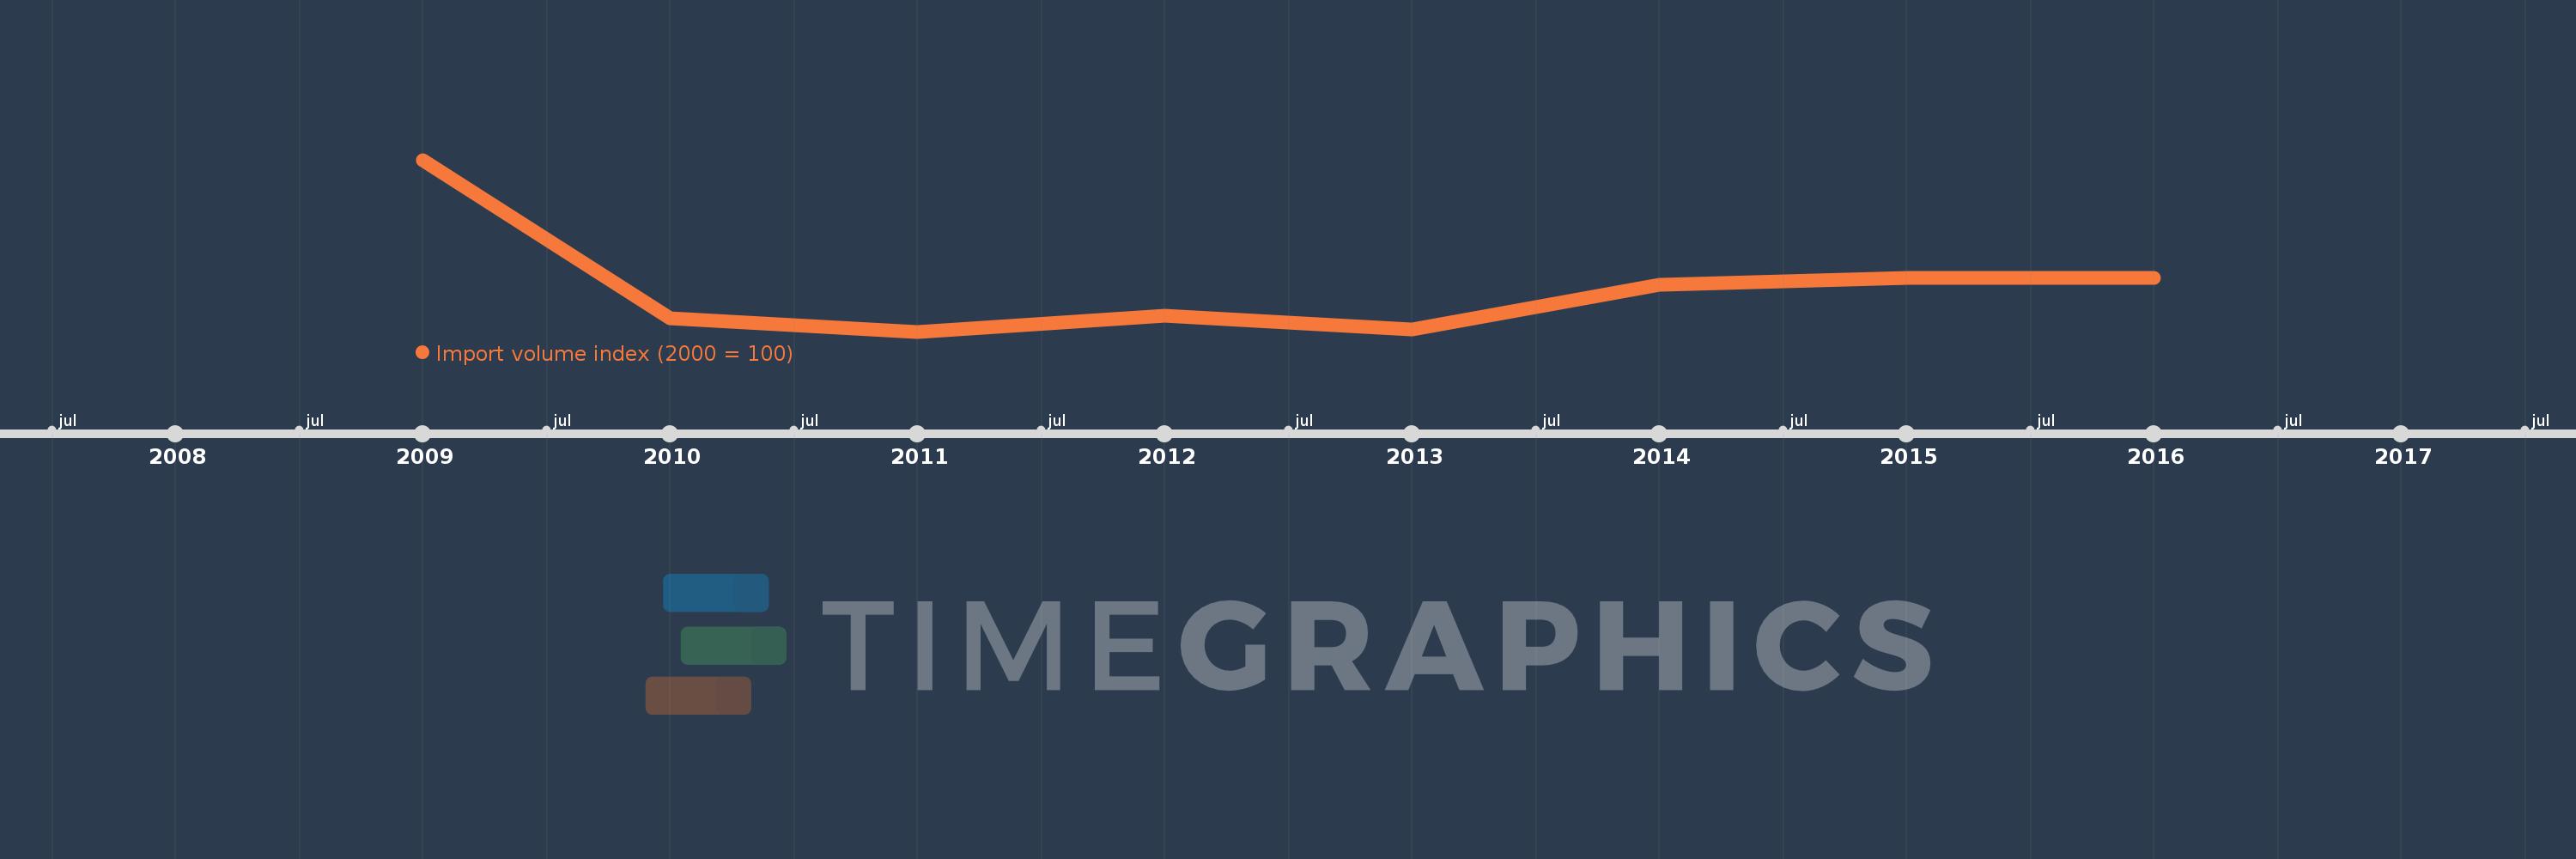
World Development Indicators
Source organization:
United Nations Conference on Trade and Development, Handbook of Statistics and data files, and International Monetary Fund, International Financial Statistics.
Categories, topics:
Private Sector, Trade
Last updated:
apr 23, 2017
Indicators value changes by year
Meaning:
296.203
Minimum:
267.568
jan 1, 2011
Maximum:
377.586
jan 1, 2009
At the date of observation
Value
Absolute change
Change from the previous value
jan 1, 2009
377.586
+377.586
0.0%
jan 1, 2010
276.019
-101.568
-26.9%
jan 1, 2011
267.568
-8.451
-3.06%
jan 1, 2012
277.957
+10.389
3.88%
jan 1, 2013
268.952
-9.006
-3.24%
jan 1, 2014
297.805
+28.854
10.73%
jan 1, 2015
301.864
+4.059
1.36%
jan 1, 2016
301.872
+0.007
0.0%
Ranking of countries by current statistics by years