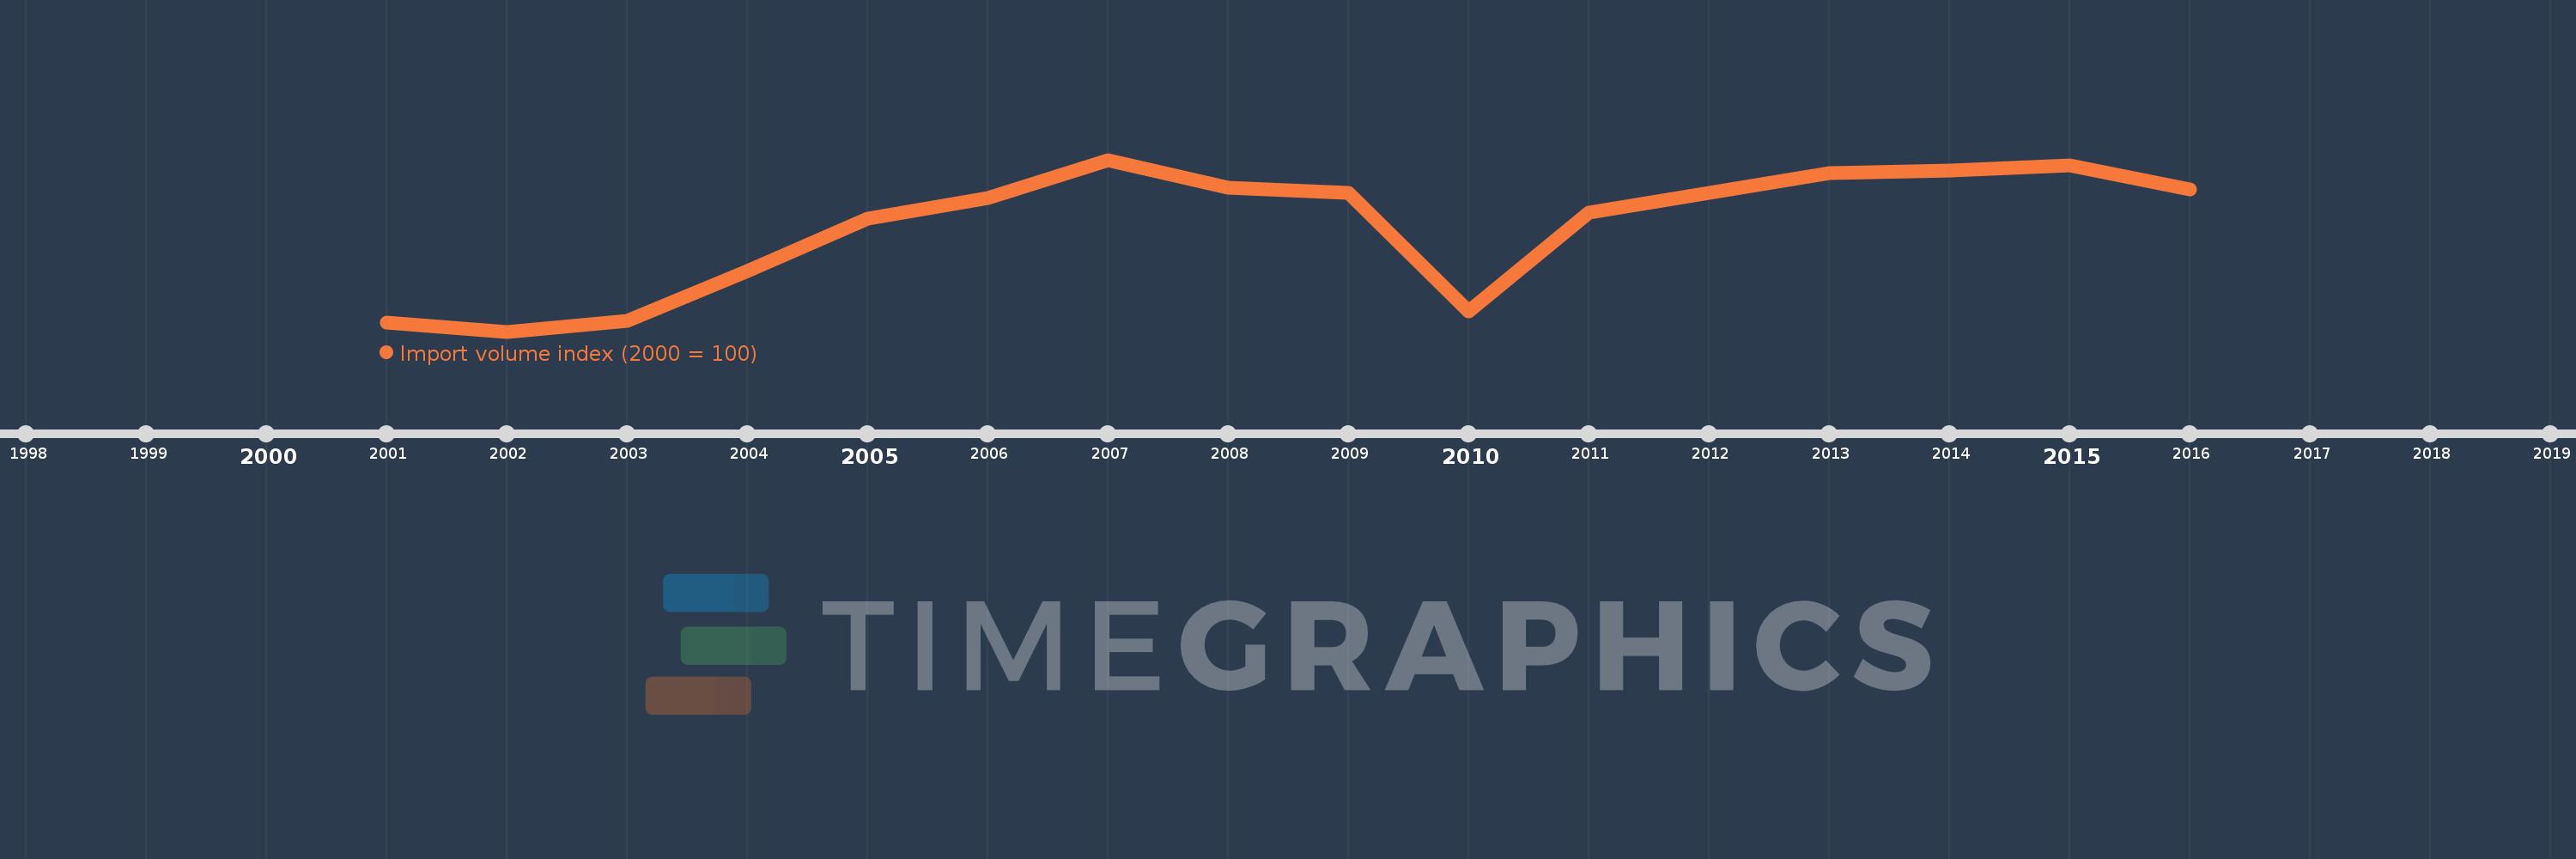
This timeline shows a graph from 2001 to 2016 of Japan. No data until 2000. Number of actual observations by date: 16.
Source name:
World Development Indicators
Source organization:
United Nations Conference on Trade and Development, Handbook of Statistics and data files, and International Monetary Fund, International Financial Statistics.
Categories, topics:
Private Sector, Trade
Last updated:
apr 23, 2017
Indicators value changes by year
Meaning:
113.837
Minimum:
98.669
jan 1, 2002
Maximum:
123.388
jan 1, 2007
At the date of observation
Value
Absolute change
Change from the previous value
jan 1, 2001
100.0
+100.0
0.0%
jan 1, 2002
98.669
-1.331
-1.33%
jan 1, 2003
100.243
+1.574
1.6%
jan 1, 2004
107.441
+7.198
7.18%
jan 1, 2005
114.871
+7.43
6.92%
jan 1, 2006
117.926
+3.055
2.66%
jan 1, 2007
123.388
+5.462
4.63%
jan 1, 2008
119.315
-4.074
-3.3%
jan 1, 2009
118.574
-0.741
-0.62%
jan 1, 2010
101.551
-17.023
-14.36%
jan 1, 2011
115.727
+14.177
13.96%
jan 1, 2012
118.678
+2.951
2.55%
jan 1, 2013
121.479
+2.801
2.36%
jan 1, 2014
121.826
+0.347
0.29%
jan 1, 2015
122.567
+0.741
0.61%
jan 1, 2016
119.141
-3.426
-2.79%
Ranking of countries by current statistics by years