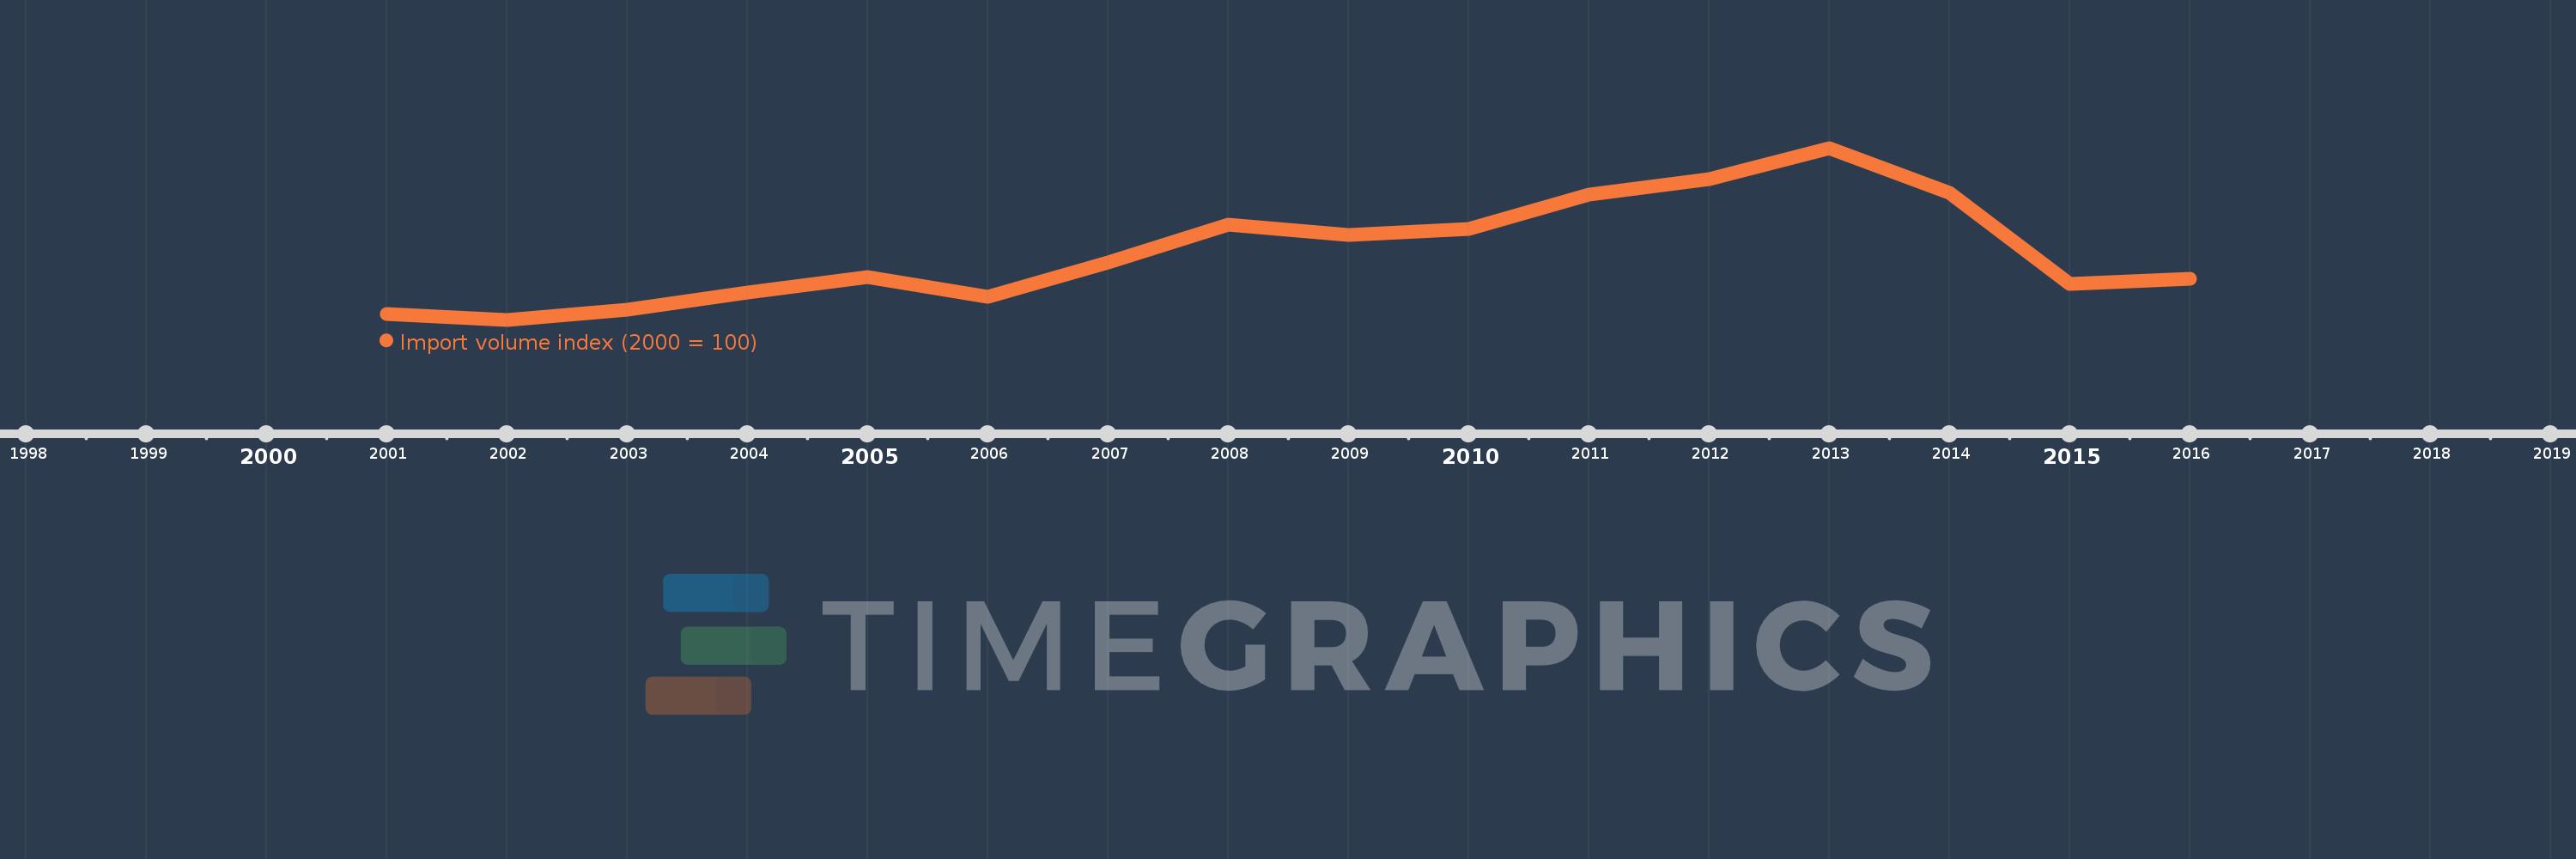
This timeline shows a graph from 2001 to 2016 of Papua New Guinea. No data until 2000. Number of actual observations by date: 16.
Source name:
World Development Indicators
Source organization:
United Nations Conference on Trade and Development, Handbook of Statistics and data files, and International Monetary Fund, International Financial Statistics.
Categories, topics:
Private Sector, Trade
Last updated:
apr 23, 2017
Indicators value changes by year
Meaning:
142.317
Minimum:
96.345
jan 1, 2002
Maximum:
213.625
jan 1, 2013
At the date of observation
Value
Absolute change
Change from the previous value
jan 1, 2001
100.0
+100.0
0.0%
jan 1, 2002
96.345
-3.655
-3.65%
jan 1, 2003
102.971
+6.626
6.88%
jan 1, 2004
115.001
+12.029
11.68%
jan 1, 2005
125.653
+10.652
9.26%
jan 1, 2006
112.041
-13.612
-10.83%
jan 1, 2007
135.654
+23.613
21.08%
jan 1, 2008
161.442
+25.788
19.01%
jan 1, 2009
154.36
-7.082
-4.39%
jan 1, 2010
158.483
+4.123
2.67%
jan 1, 2011
181.583
+23.099
14.58%
jan 1, 2012
192.125
+10.543
5.81%
jan 1, 2013
213.625
+21.5
11.19%
jan 1, 2014
182.924
-30.701
-14.37%
jan 1, 2015
120.717
-62.207
-34.01%
jan 1, 2016
124.149
+3.433
2.84%
Ranking of countries by current statistics by years