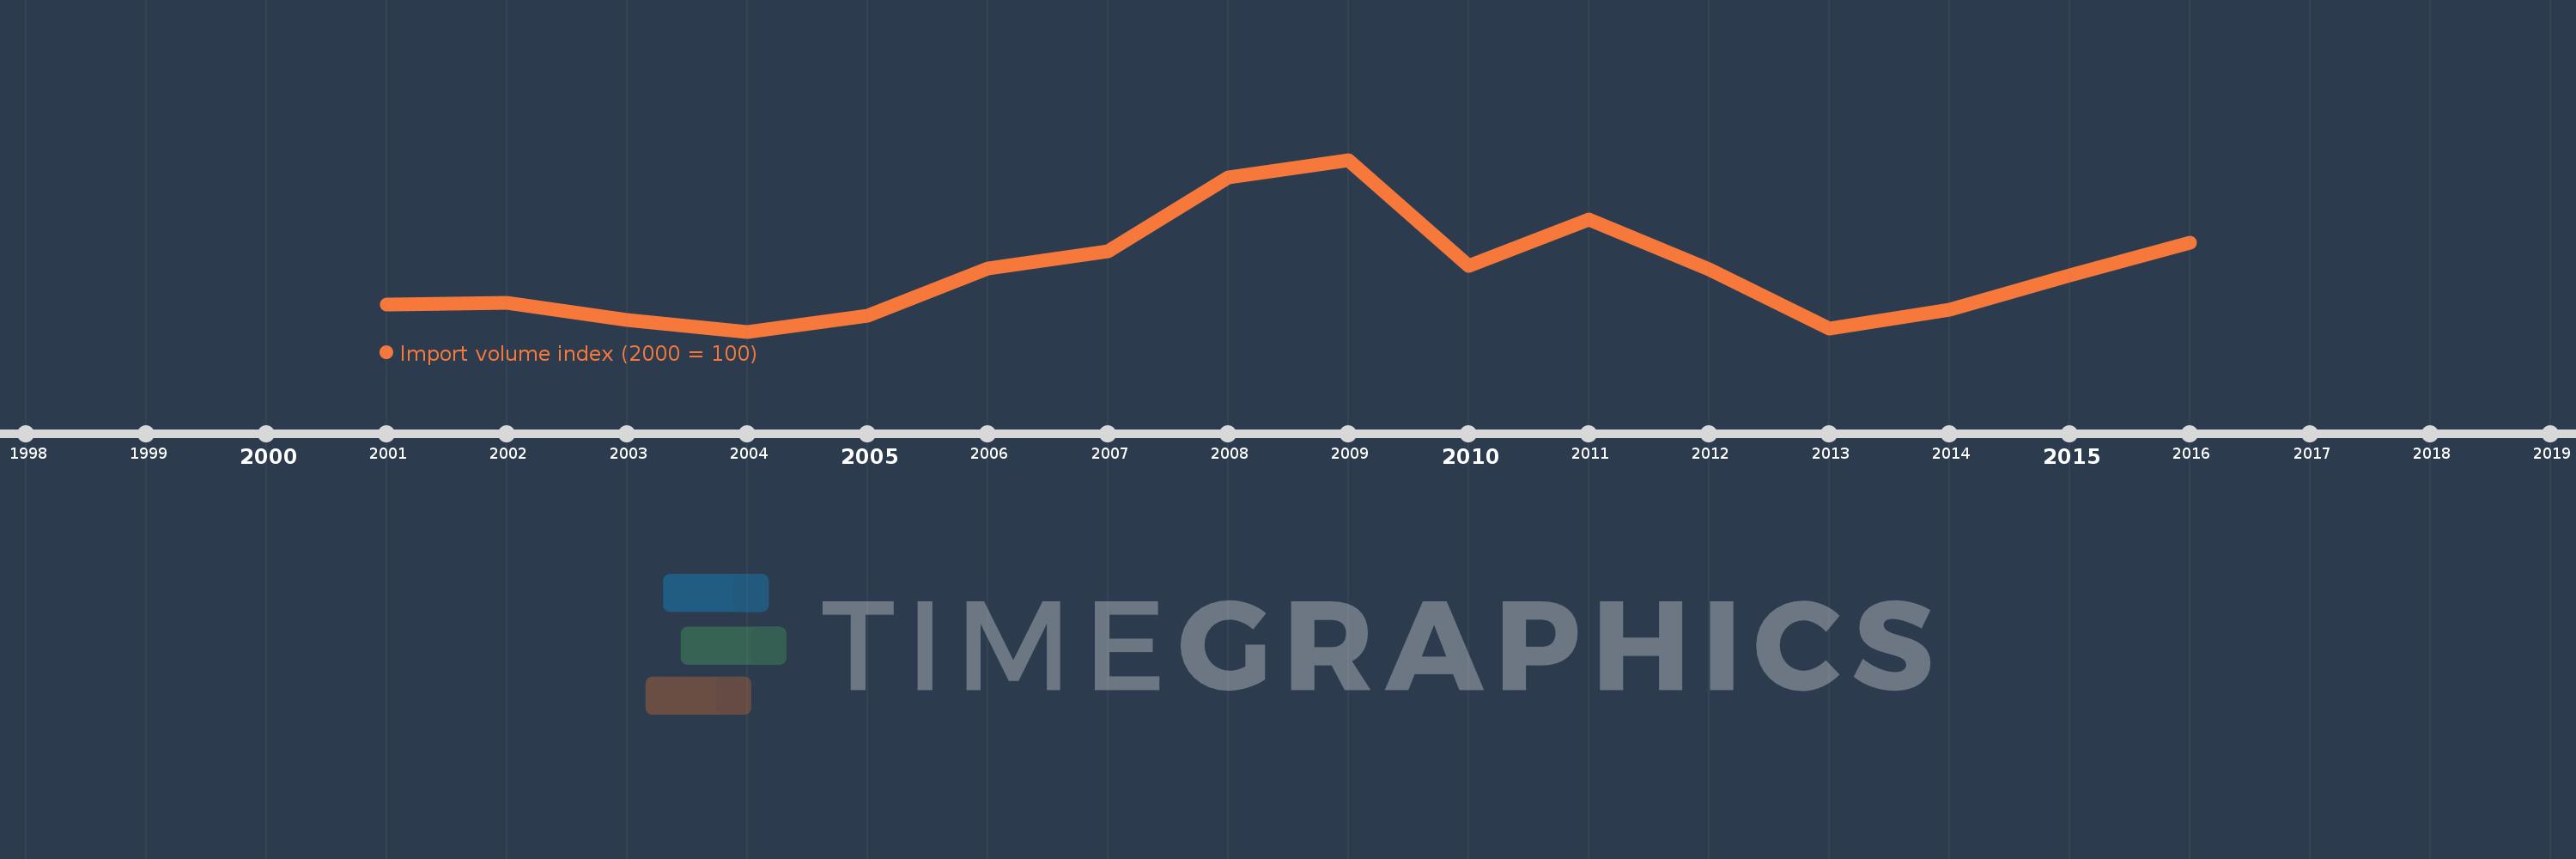
This timeline shows a graph from 2001 to 2016 of Portugal. No data until 2000. Number of actual observations by date: 16.
Source name:
World Development Indicators
Source organization:
United Nations Conference on Trade and Development, Handbook of Statistics and data files, and International Monetary Fund, International Financial Statistics.
Categories, topics:
Private Sector, Trade
Last updated:
apr 23, 2017
Indicators value changes by year
Meaning:
104.862
Minimum:
95.985
jan 1, 2004
Maximum:
121.342
jan 1, 2009
At the date of observation
Value
Absolute change
Change from the previous value
jan 1, 2001
100.0
+100.0
0.0%
jan 1, 2002
100.207
+0.207
0.21%
jan 1, 2003
97.695
-2.512
-2.51%
jan 1, 2004
95.985
-1.71
-1.75%
jan 1, 2005
98.272
+2.288
2.38%
jan 1, 2006
105.349
+7.077
7.2%
jan 1, 2007
107.782
+2.434
2.31%
jan 1, 2008
118.801
+11.019
10.22%
jan 1, 2009
121.342
+2.54
2.14%
jan 1, 2010
105.621
-15.72
-12.96%
jan 1, 2011
112.503
+6.881
6.52%
jan 1, 2012
105.23
-7.272
-6.46%
jan 1, 2013
96.372
-8.859
-8.42%
jan 1, 2014
99.176
+2.804
2.91%
jan 1, 2015
104.309
+5.134
5.18%
jan 1, 2016
109.145
+4.836
4.64%
Ranking of countries by current statistics by years