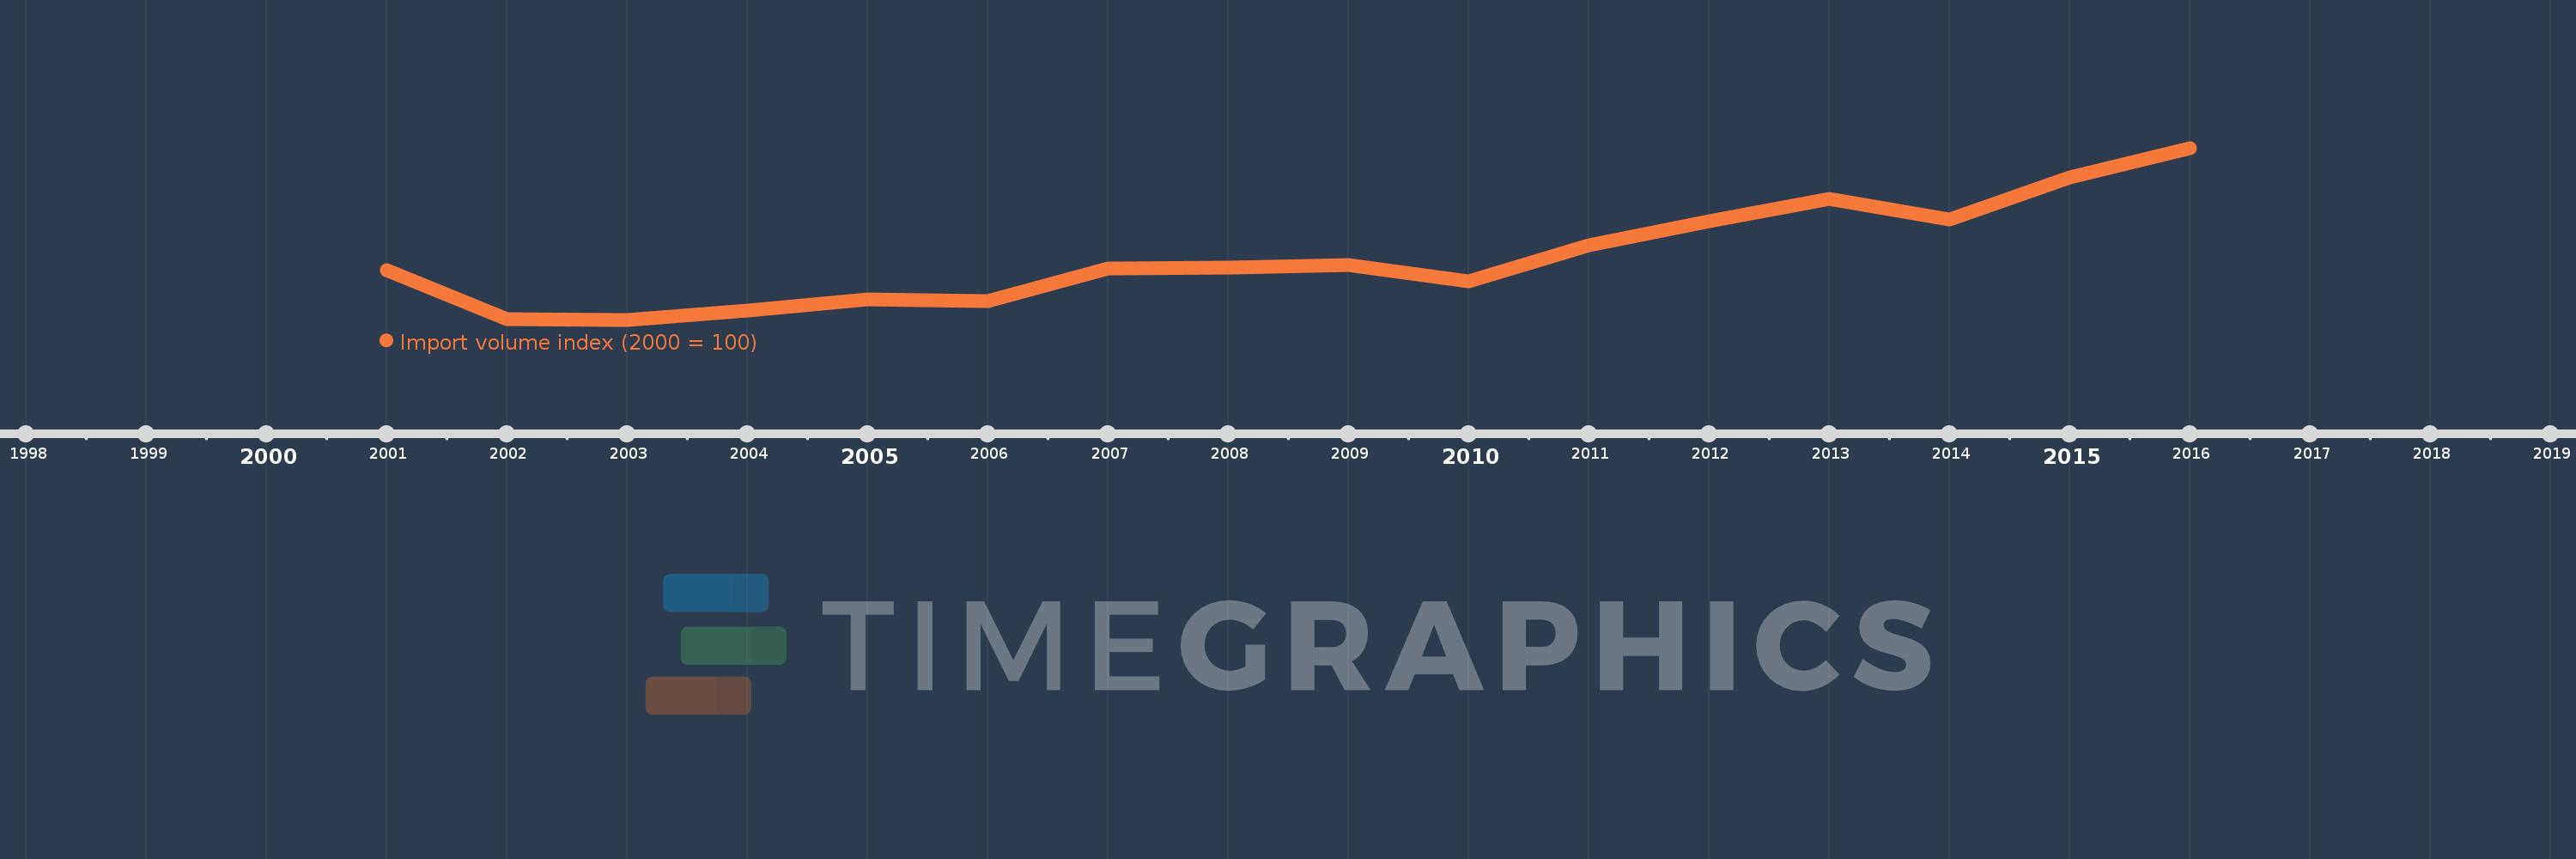
This timeline shows a graph from 2001 to 2016 of Malta. No data until 2000. Number of actual observations by date: 16.
Source name:
World Development Indicators
Source organization:
United Nations Conference on Trade and Development, Handbook of Statistics and data files, and International Monetary Fund, International Financial Statistics.
Categories, topics:
Private Sector, Trade
Last updated:
apr 23, 2017
Indicators value changes by year
Meaning:
105.029
Minimum:
80.349
jan 1, 2003
Maximum:
147.972
jan 1, 2016
At the date of observation
Value
Absolute change
Change from the previous value
jan 1, 2001
100.0
+100.0
0.0%
jan 1, 2002
80.506
-19.494
-19.49%
jan 1, 2003
80.349
-0.157
-0.2%
jan 1, 2004
84.055
+3.706
4.61%
jan 1, 2005
88.263
+4.208
5.01%
jan 1, 2006
87.536
-0.727
-0.82%
jan 1, 2007
100.406
+12.87
14.7%
jan 1, 2008
100.786
+0.38
0.38%
jan 1, 2009
101.973
+1.188
1.18%
jan 1, 2010
95.624
-6.35
-6.23%
jan 1, 2011
109.762
+14.139
14.79%
jan 1, 2012
119.151
+9.388
8.55%
jan 1, 2013
128.013
+8.863
7.44%
jan 1, 2014
119.799
-8.215
-6.42%
jan 1, 2015
136.267
+16.468
13.75%
jan 1, 2016
147.972
+11.706
8.59%
Ranking of countries by current statistics by years