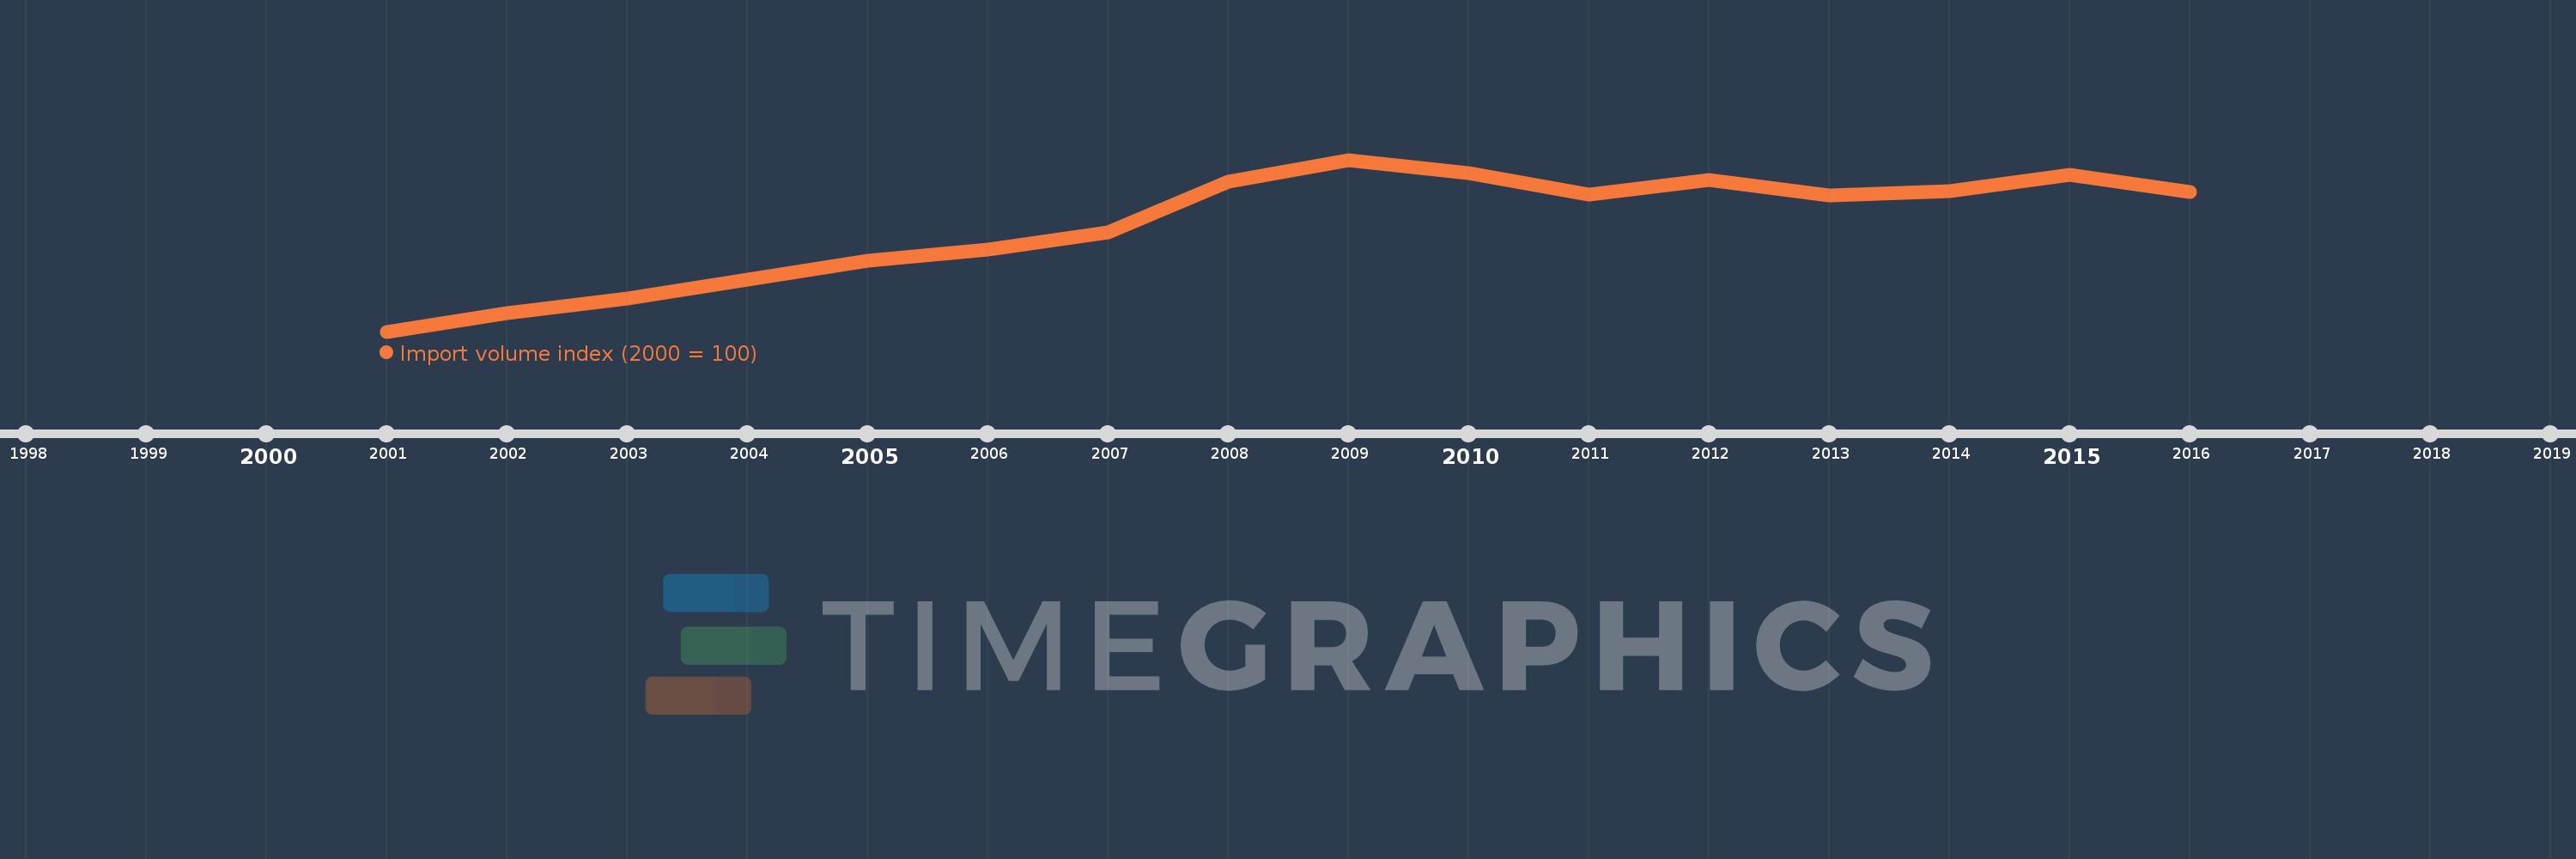
This timeline shows a graph from 2001 to 2016 of Albania. No data until 2000. Number of actual observations by date: 16.
Source name:
World Development Indicators
Source organization:
United Nations Conference on Trade and Development, Handbook of Statistics and data files, and International Monetary Fund, International Financial Statistics.
Categories, topics:
Private Sector, Trade
Last updated:
apr 23, 2017
Indicators value changes by year
Meaning:
224.603
Minimum:
100.0
jan 1, 2001
Maximum:
301.747
jan 1, 2009
At the date of observation
Value
Absolute change
Change from the previous value
jan 1, 2001
100.0
+100.0
0.0%
jan 1, 2002
121.624
+21.624
21.62%
jan 1, 2003
138.902
+17.278
14.21%
jan 1, 2004
160.631
+21.729
15.64%
jan 1, 2005
183.475
+22.844
14.22%
jan 1, 2006
196.036
+12.561
6.85%
jan 1, 2007
216.257
+20.221
10.32%
jan 1, 2008
276.442
+60.185
27.83%
jan 1, 2009
301.747
+25.304
9.15%
jan 1, 2010
286.601
-15.146
-5.02%
jan 1, 2011
261.289
-25.312
-8.83%
jan 1, 2012
278.517
+17.228
6.59%
jan 1, 2013
259.883
-18.634
-6.69%
jan 1, 2014
264.876
+4.993
1.92%
jan 1, 2015
283.933
+19.057
7.19%
jan 1, 2016
263.432
-20.501
-7.22%
Ranking of countries by current statistics by years