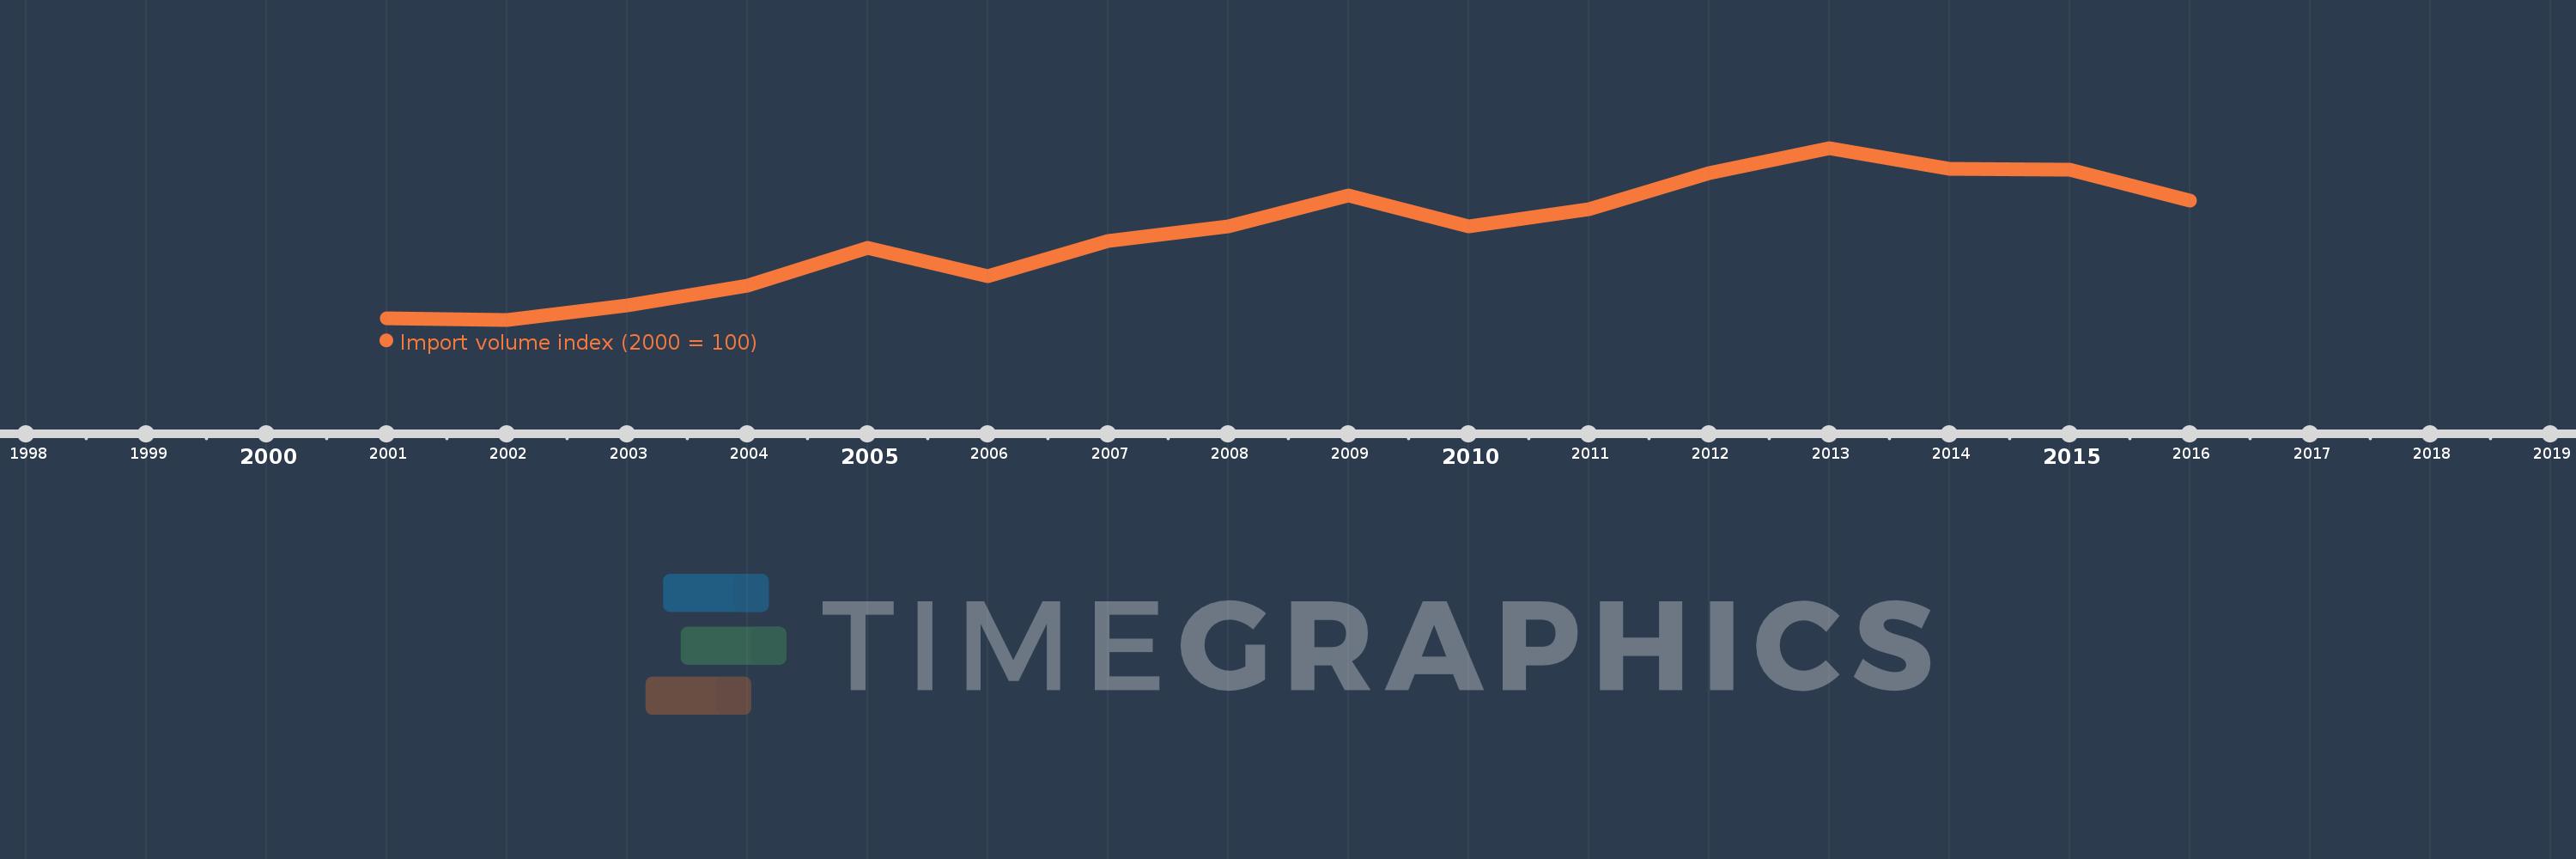
This timeline shows a graph from 2001 to 2016 of Belarus. No data until 2000. Number of actual observations by date: 16.
Source name:
World Development Indicators
Source organization:
United Nations Conference on Trade and Development, Handbook of Statistics and data files, and International Monetary Fund, International Financial Statistics.
Categories, topics:
Private Sector, Trade
Last updated:
apr 23, 2017
Indicators value changes by year
Meaning:
171.241
Minimum:
99.002
jan 1, 2002
Maximum:
240.553
jan 1, 2013
At the date of observation
Value
Absolute change
Change from the previous value
jan 1, 2001
100.0
+100.0
0.0%
jan 1, 2002
99.002
-0.998
-1.0%
jan 1, 2003
110.853
+11.851
11.97%
jan 1, 2004
127.065
+16.212
14.62%
jan 1, 2005
157.922
+30.857
24.28%
jan 1, 2006
134.909
-23.013
-14.57%
jan 1, 2007
164.216
+29.307
21.72%
jan 1, 2008
175.97
+11.754
7.16%
jan 1, 2009
201.098
+25.128
14.28%
jan 1, 2010
175.766
-25.332
-12.6%
jan 1, 2011
189.762
+13.996
7.96%
jan 1, 2012
219.891
+30.129
15.88%
jan 1, 2013
240.553
+20.662
9.4%
jan 1, 2014
223.246
-17.307
-7.19%
jan 1, 2015
222.4
-0.846
-0.38%
jan 1, 2016
197.207
-25.193
-11.33%
Ranking of countries by current statistics by years