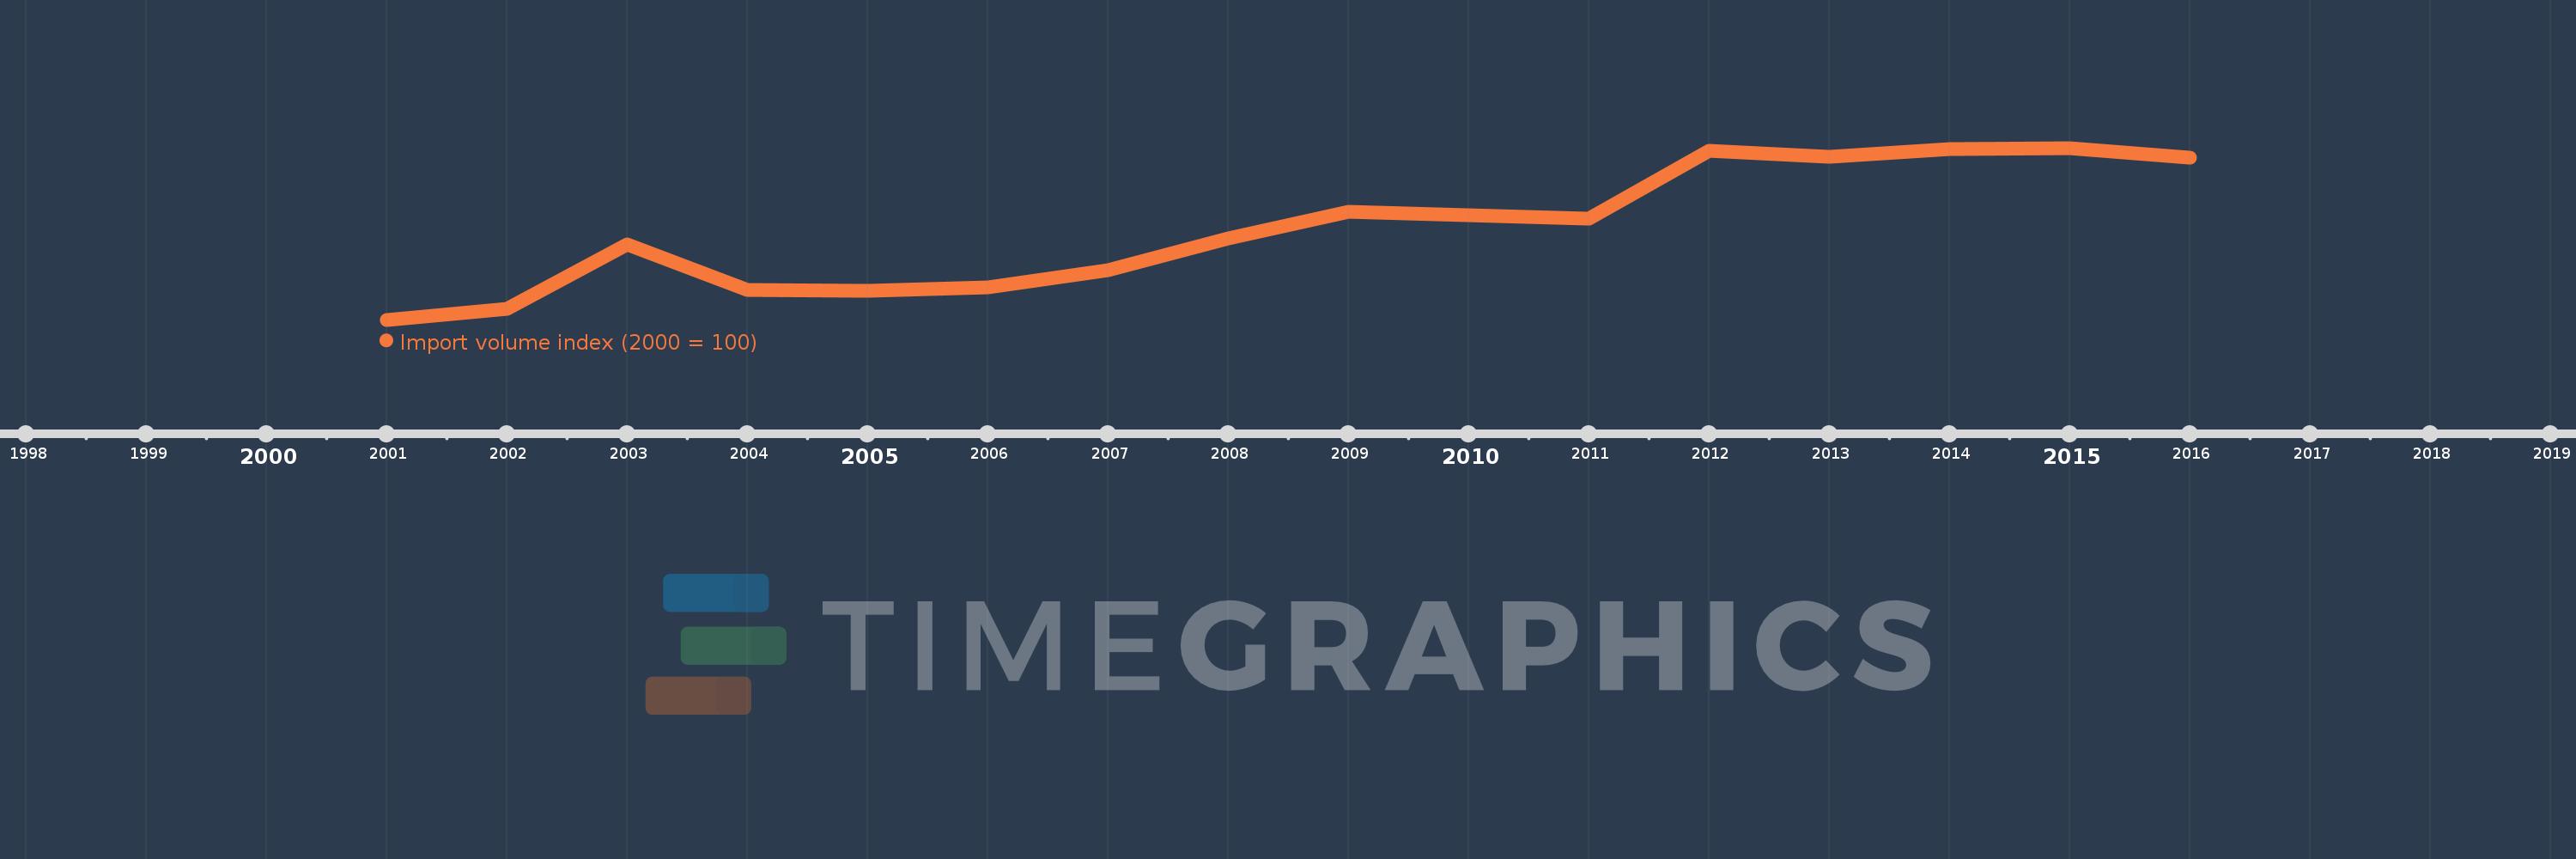
This timeline shows a graph from 2001 to 2016 of Brunei Darussalam. No data until 2000. Number of actual observations by date: 16.
Source name:
World Development Indicators
Source organization:
United Nations Conference on Trade and Development, Handbook of Statistics and data files, and International Monetary Fund, International Financial Statistics.
Categories, topics:
Private Sector, Trade
Last updated:
apr 23, 2017
Indicators value changes by year
Meaning:
151.878
Minimum:
100.0
jan 1, 2001
Maximum:
197.823
jan 1, 2015
At the date of observation
Value
Absolute change
Change from the previous value
jan 1, 2001
100.0
+100.0
0.0%
jan 1, 2002
105.971
+5.971
5.97%
jan 1, 2003
143.016
+37.045
34.96%
jan 1, 2004
116.733
-26.283
-18.38%
jan 1, 2005
116.58
-0.153
-0.13%
jan 1, 2006
118.656
+2.076
1.78%
jan 1, 2007
127.99
+9.334
7.87%
jan 1, 2008
146.414
+18.424
14.39%
jan 1, 2009
161.273
+14.859
10.15%
jan 1, 2010
159.548
-1.725
-1.07%
jan 1, 2011
157.436
-2.112
-1.32%
jan 1, 2012
196.305
+38.869
24.69%
jan 1, 2013
192.792
-3.512
-1.79%
jan 1, 2014
197.069
+4.276
2.22%
jan 1, 2015
197.823
+0.754
0.38%
jan 1, 2016
192.437
-5.386
-2.72%
Ranking of countries by current statistics by years