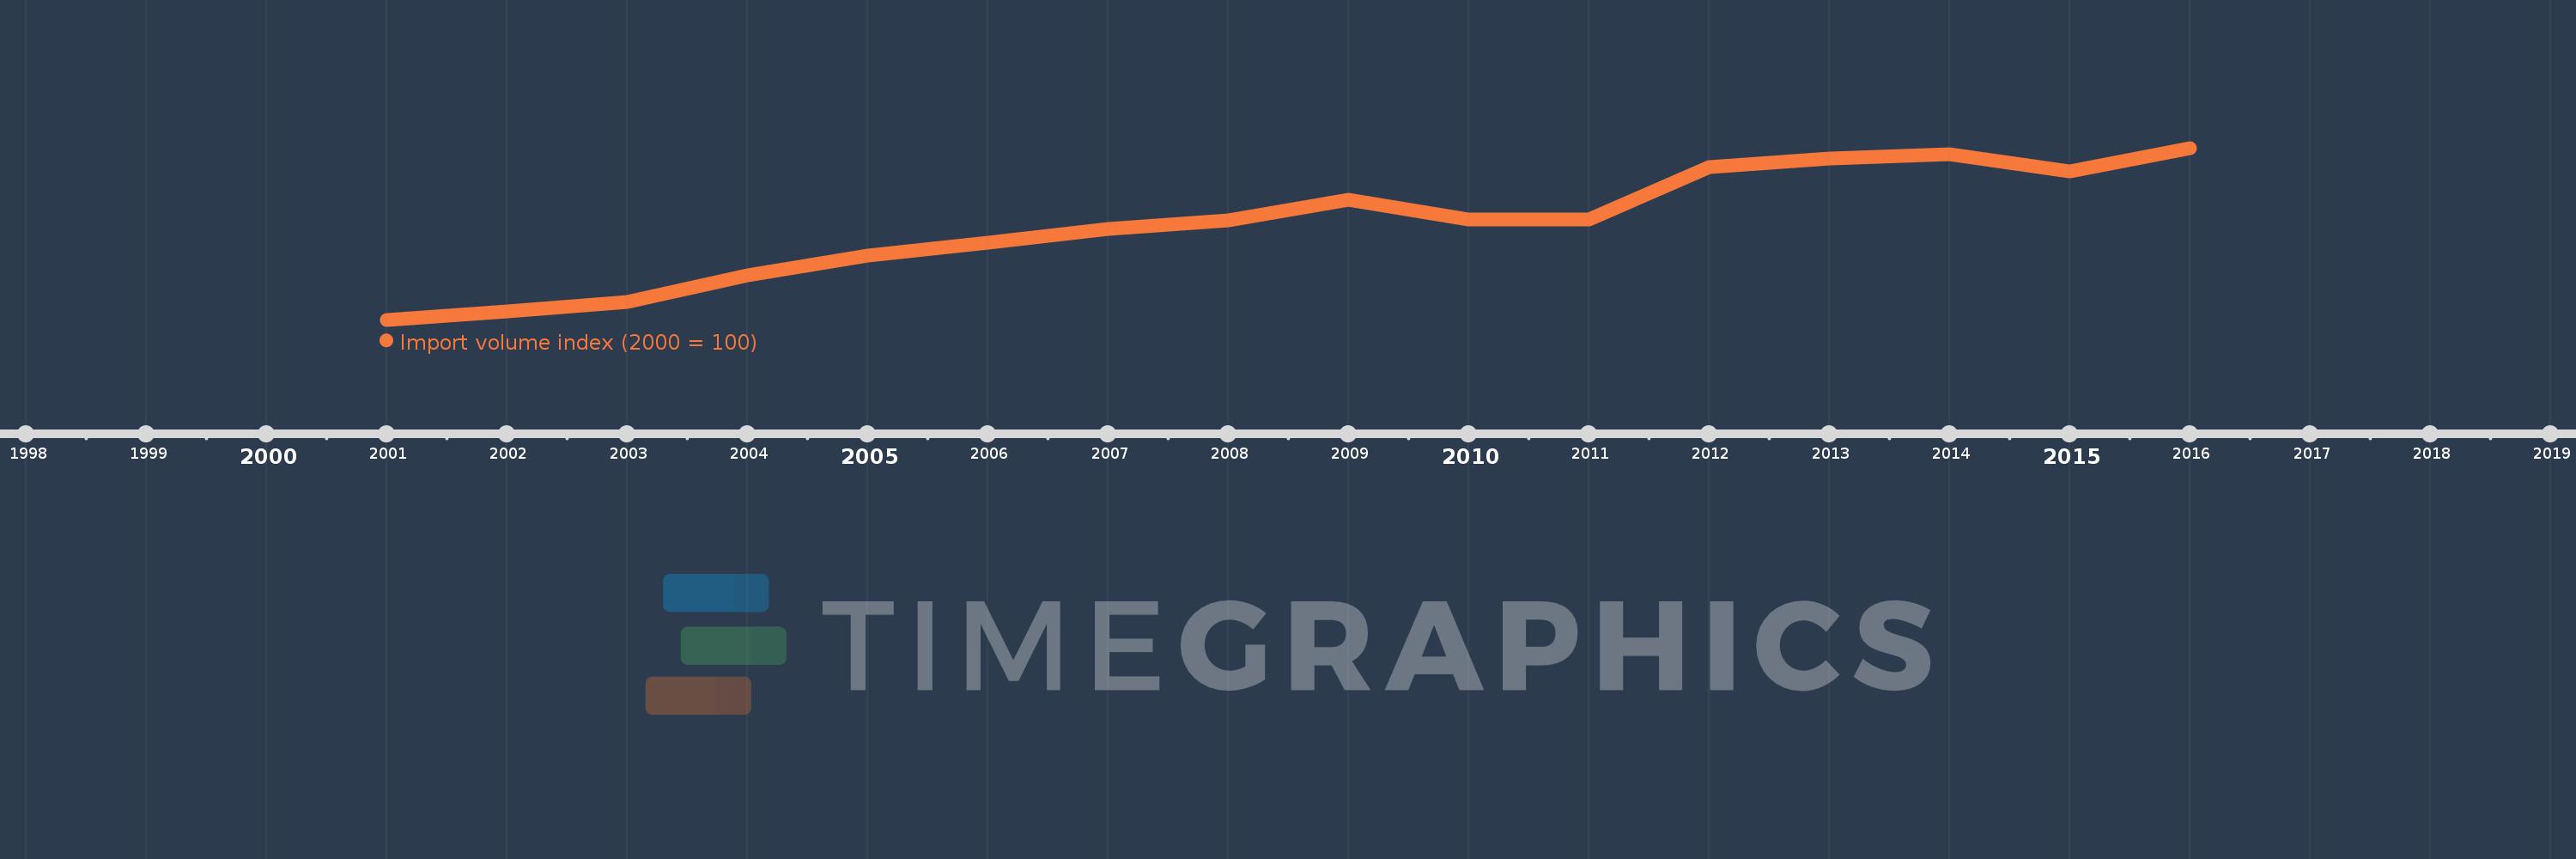
This timeline shows a graph from 2001 to 2016 of Azerbaijan. No data until 2000. Number of actual observations by date: 16.
Source name:
World Development Indicators
Source organization:
United Nations Conference on Trade and Development, Handbook of Statistics and data files, and International Monetary Fund, International Financial Statistics.
Categories, topics:
Private Sector, Trade
Last updated:
apr 23, 2017
Indicators value changes by year
Meaning:
337.99
Minimum:
100.0
jan 1, 2001
Maximum:
529.772
jan 1, 2016
At the date of observation
Value
Absolute change
Change from the previous value
jan 1, 2001
100.0
+100.0
0.0%
jan 1, 2002
119.991
+19.991
19.99%
jan 1, 2003
144.789
+24.797
20.67%
jan 1, 2004
211.318
+66.529
45.95%
jan 1, 2005
259.649
+48.331
22.87%
jan 1, 2006
293.63
+33.98
13.09%
jan 1, 2007
327.092
+33.463
11.4%
jan 1, 2008
348.617
+21.524
6.58%
jan 1, 2009
400.353
+51.737
14.84%
jan 1, 2010
351.111
-49.242
-12.3%
jan 1, 2011
351.545
+0.434
0.12%
jan 1, 2012
481.937
+130.392
37.09%
jan 1, 2013
503.111
+21.174
4.39%
jan 1, 2014
513.569
+10.458
2.08%
jan 1, 2015
471.36
-42.21
-8.22%
jan 1, 2016
529.772
+58.412
12.39%
Ranking of countries by current statistics by years