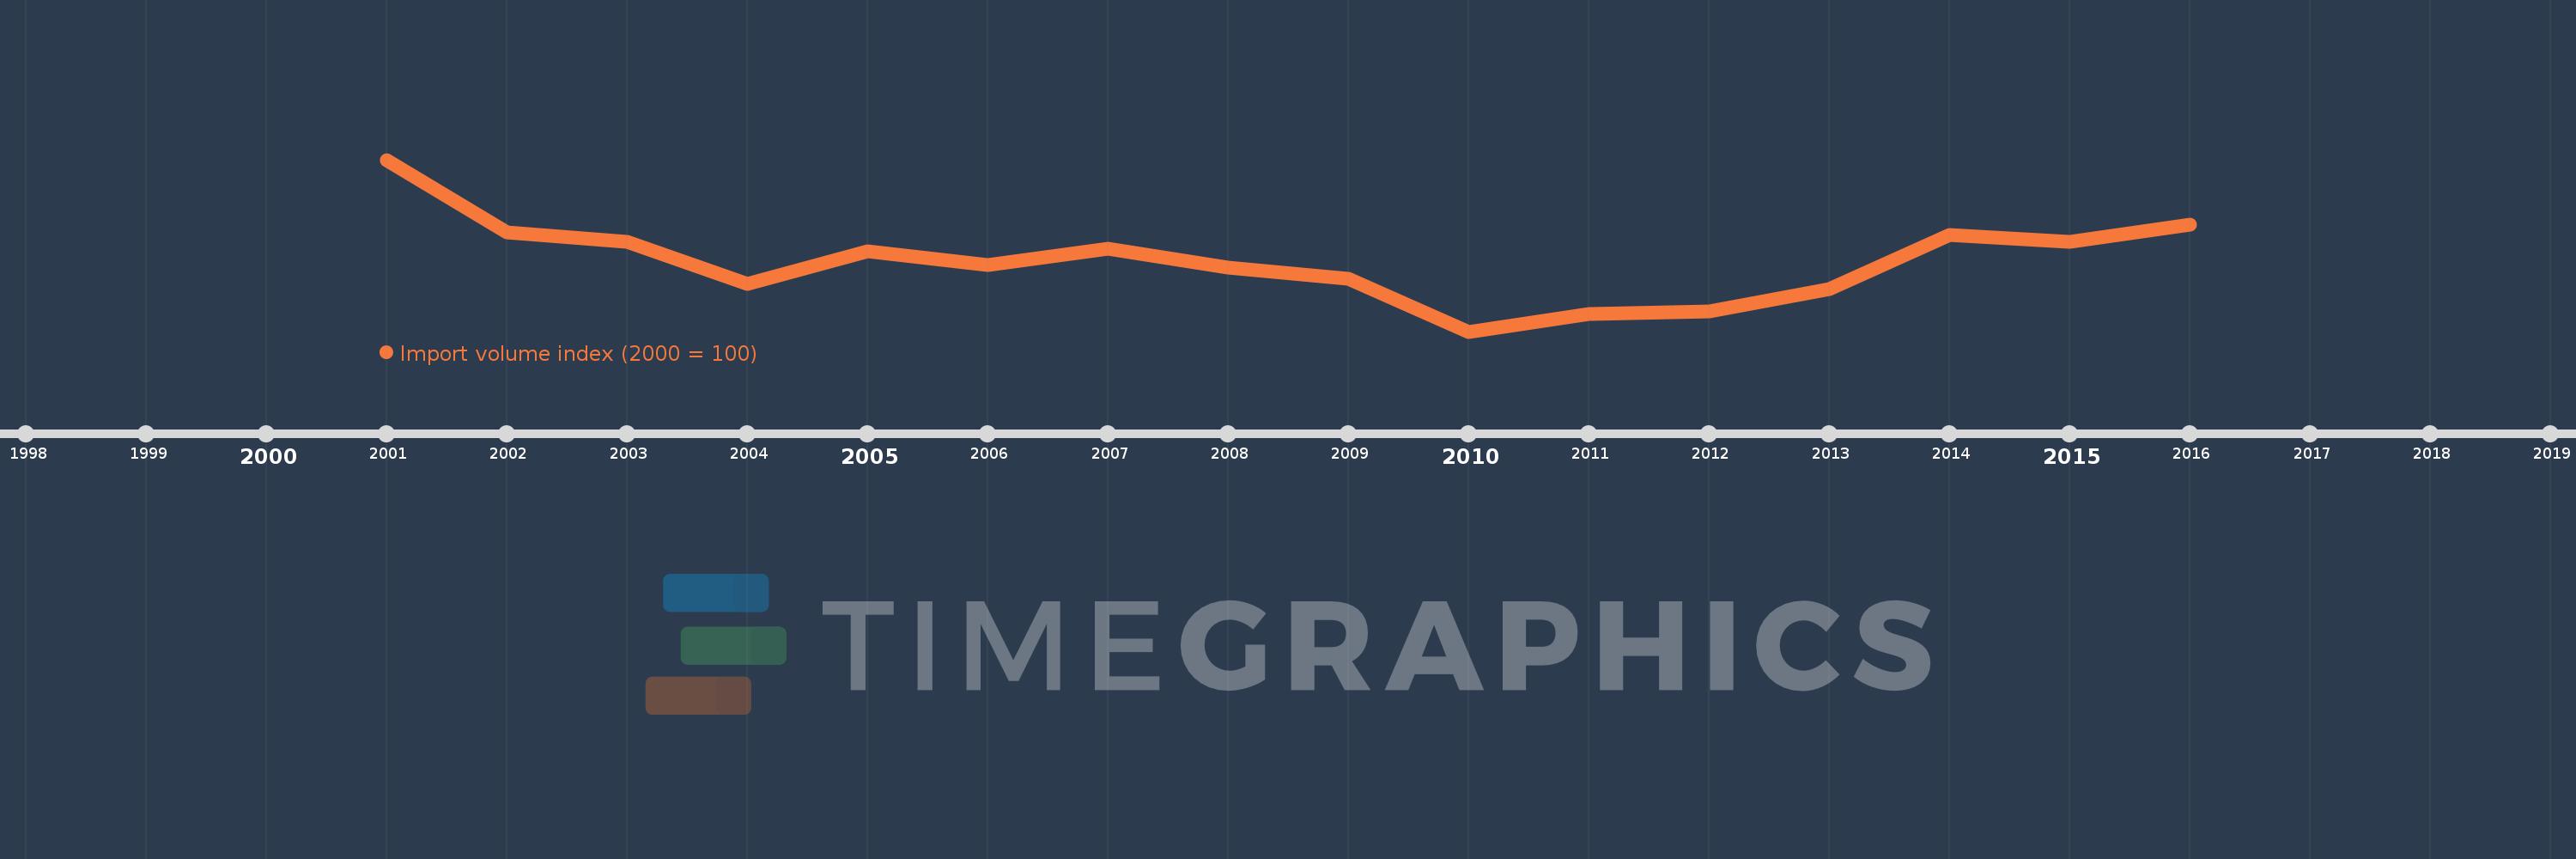
This timeline shows a graph from 2001 to 2016 of Palau. No data until 2000. Number of actual observations by date: 16.
Source name:
World Development Indicators
Source organization:
United Nations Conference on Trade and Development, Handbook of Statistics and data files, and International Monetary Fund, International Financial Statistics.
Categories, topics:
Private Sector, Trade
Last updated:
apr 23, 2017
Indicators value changes by year
Meaning:
72.88
Minimum:
54.0
jan 1, 2010
Maximum:
100.0
jan 1, 2001
At the date of observation
Value
Absolute change
Change from the previous value
jan 1, 2001
100.0
+100.0
0.0%
jan 1, 2002
80.452
-19.548
-19.55%
jan 1, 2003
77.973
-2.479
-3.08%
jan 1, 2004
66.831
-11.141
-14.29%
jan 1, 2005
75.539
+8.707
13.03%
jan 1, 2006
71.935
-3.603
-4.77%
jan 1, 2007
76.095
+4.16
5.78%
jan 1, 2008
71.226
-4.869
-6.4%
jan 1, 2009
68.231
-2.995
-4.21%
jan 1, 2010
54.0
-14.231
-20.86%
jan 1, 2011
58.619
+4.619
8.55%
jan 1, 2012
59.502
+0.884
1.51%
jan 1, 2013
65.309
+5.807
9.76%
jan 1, 2014
79.79
+14.48
22.17%
jan 1, 2015
78.057
-1.733
-2.17%
jan 1, 2016
82.527
+4.469
5.73%
Ranking of countries by current statistics by years