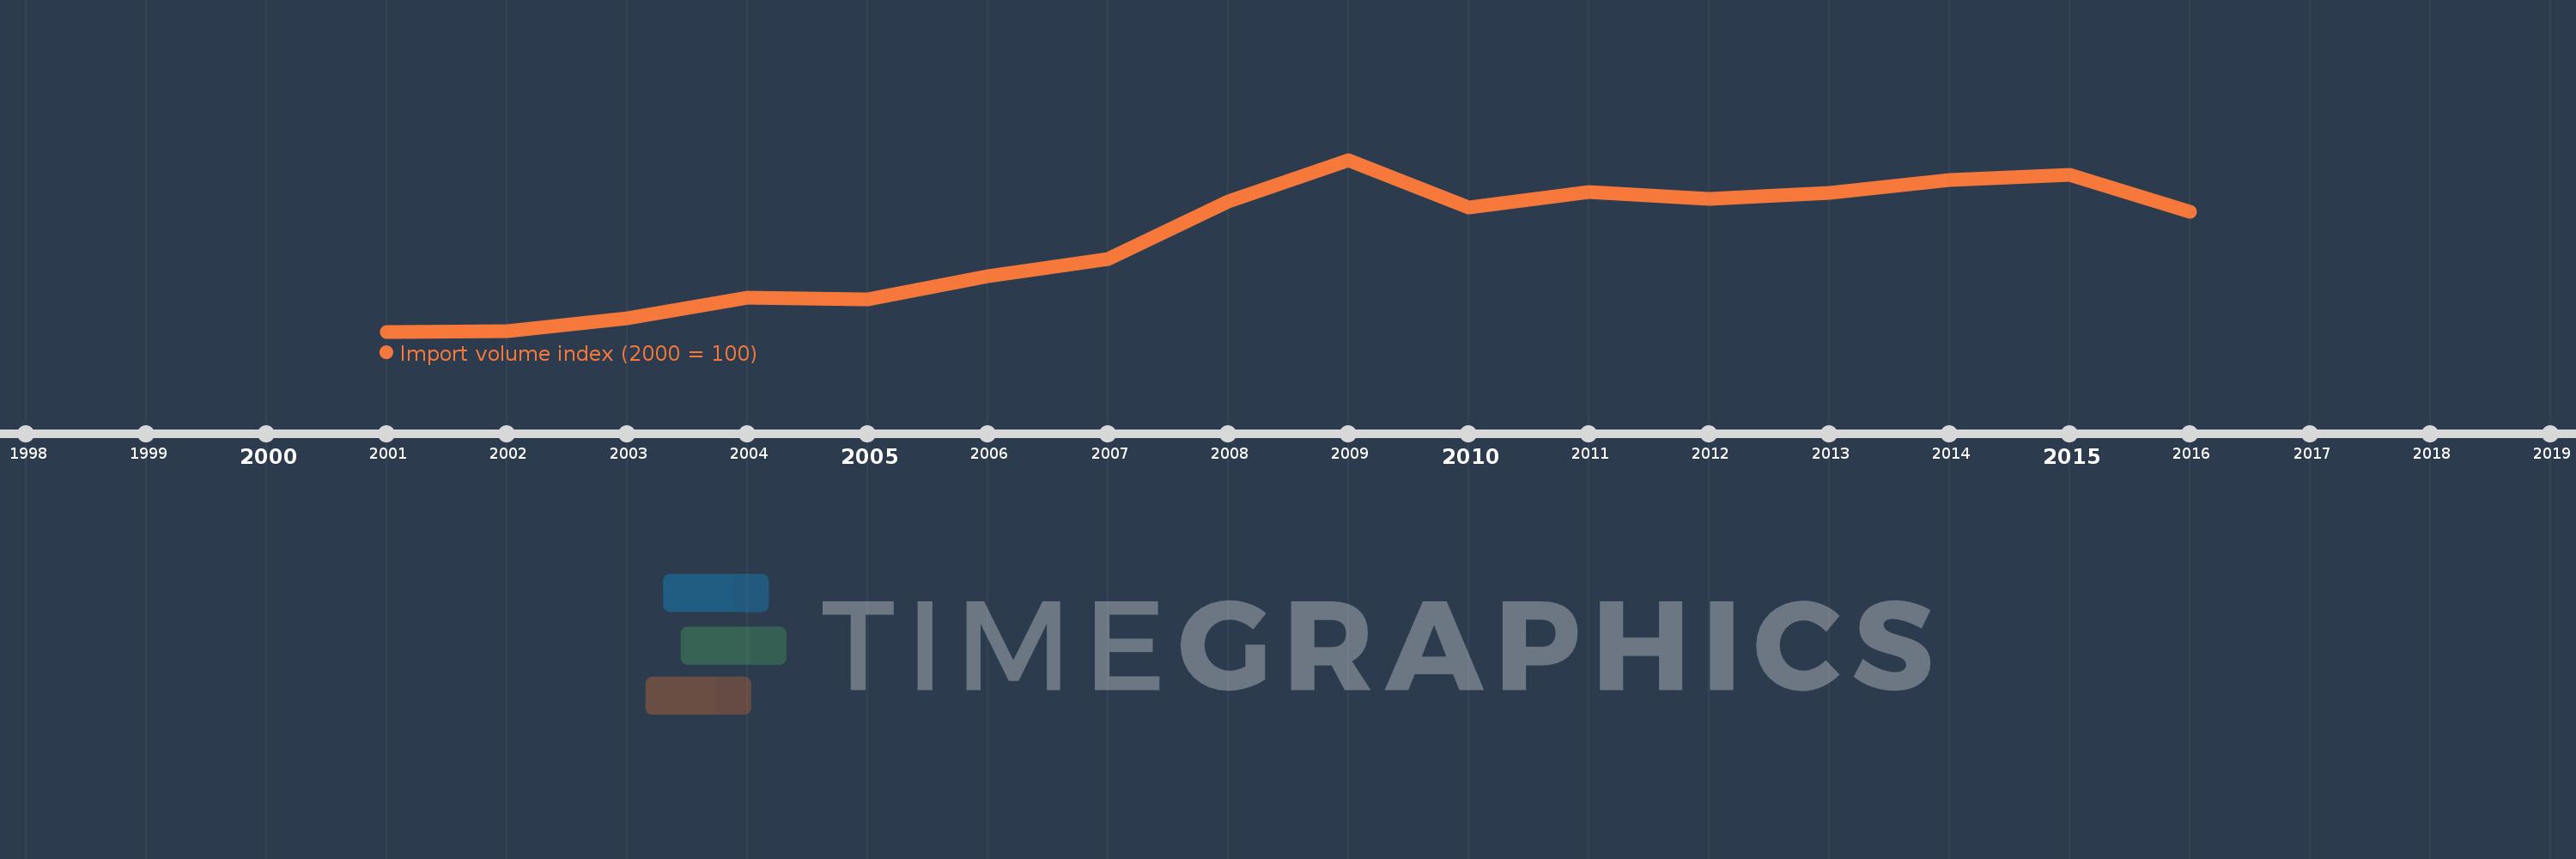
This timeline shows a graph from 2001 to 2016 of Armenia. No data until 2000. Number of actual observations by date: 16.
Source name:
World Development Indicators
Source organization:
United Nations Conference on Trade and Development, Handbook of Statistics and data files, and International Monetary Fund, International Financial Statistics.
Categories, topics:
Private Sector, Trade
Last updated:
apr 23, 2017
Indicators value changes by year
Meaning:
214.249
Minimum:
100.0
jan 1, 2001
Maximum:
313.262
jan 1, 2009
At the date of observation
Value
Absolute change
Change from the previous value
jan 1, 2001
100.0
+100.0
0.0%
jan 1, 2002
100.337
+0.337
0.34%
jan 1, 2003
116.627
+16.291
16.24%
jan 1, 2004
142.446
+25.818
22.14%
jan 1, 2005
139.763
-2.683
-1.88%
jan 1, 2006
168.378
+28.615
20.47%
jan 1, 2007
189.774
+21.396
12.71%
jan 1, 2008
261.564
+71.79
37.83%
jan 1, 2009
313.262
+51.699
19.77%
jan 1, 2010
253.884
-59.378
-18.95%
jan 1, 2011
273.601
+19.716
7.77%
jan 1, 2012
264.456
-9.145
-3.34%
jan 1, 2013
272.463
+8.007
3.03%
jan 1, 2014
288.262
+15.8
5.8%
jan 1, 2015
294.731
+6.469
2.24%
jan 1, 2016
248.445
-46.286
-15.7%
Ranking of countries by current statistics by years