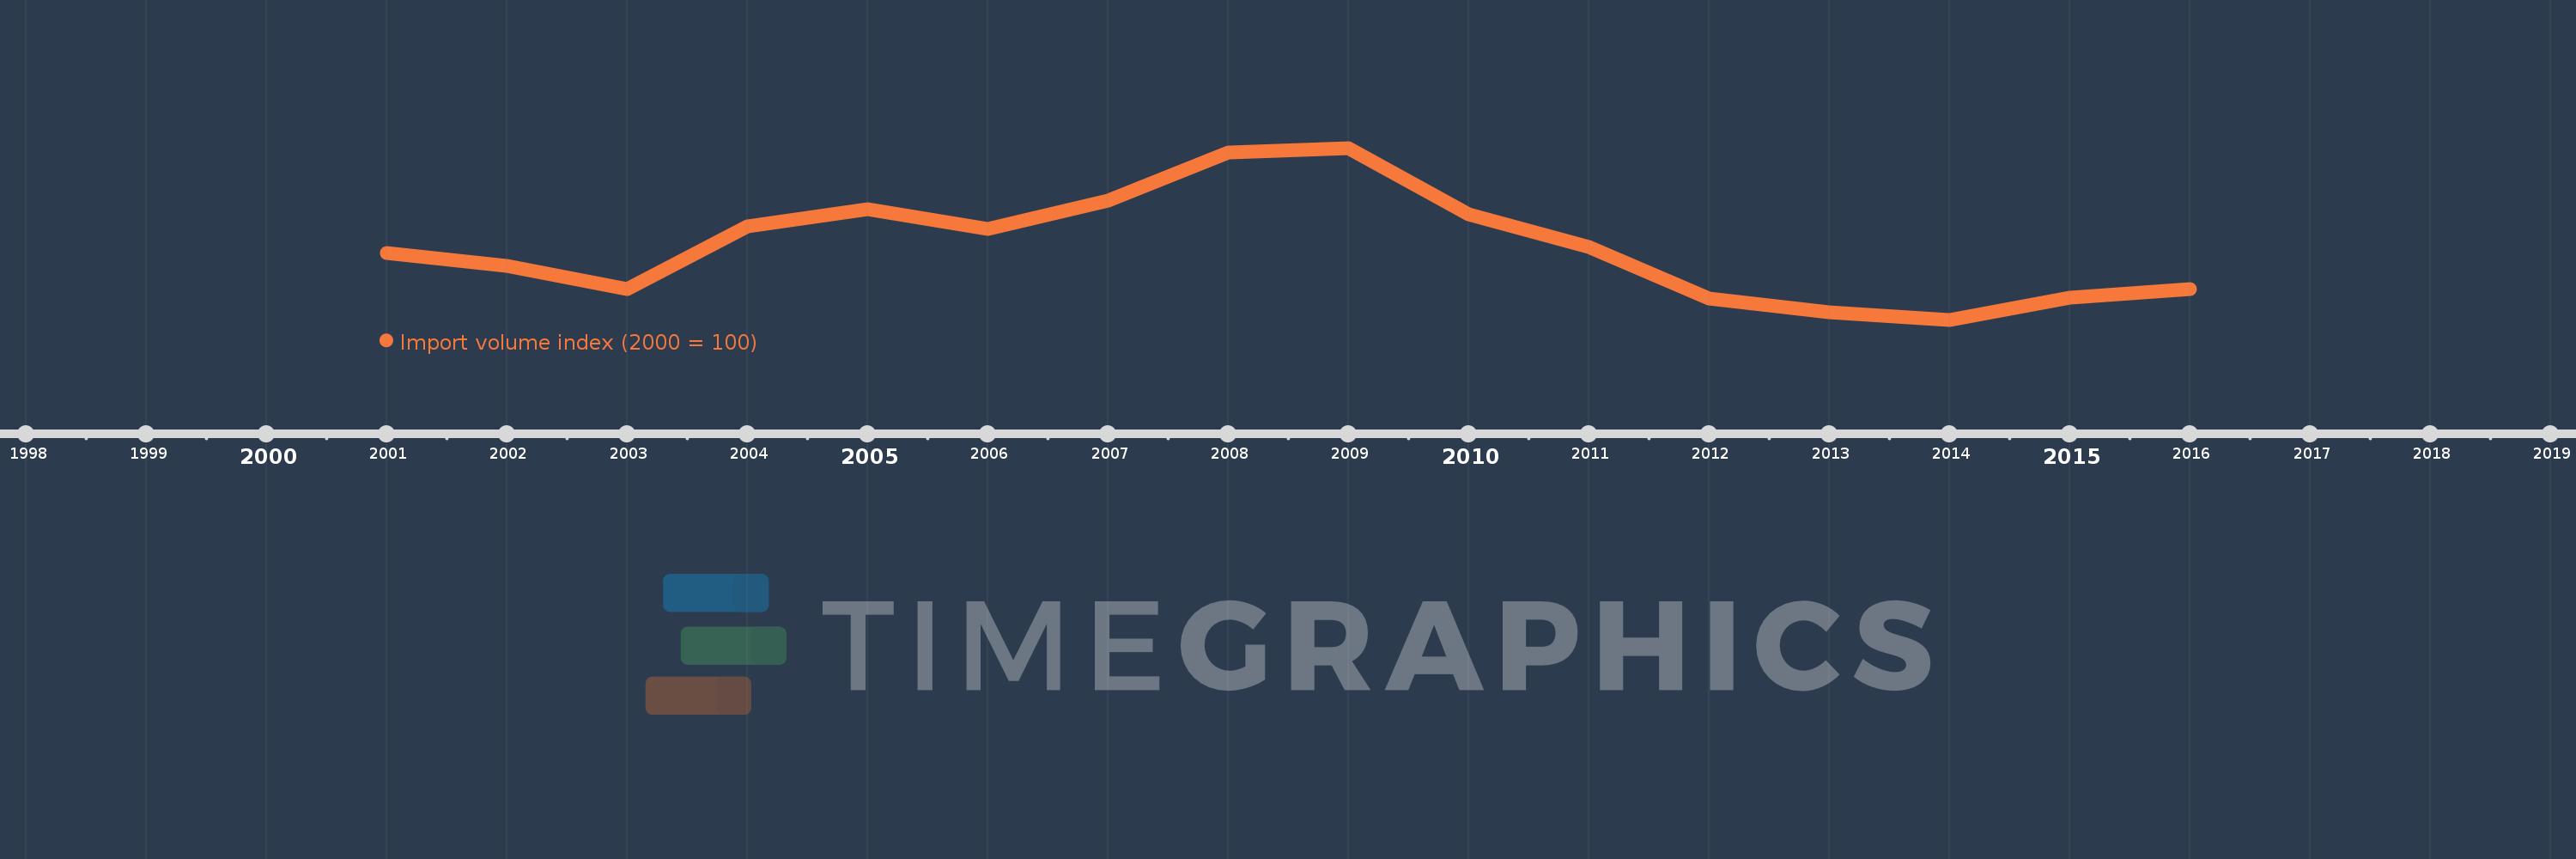
This timeline shows a graph from 2001 to 2016 of Greece. No data until 2000. Number of actual observations by date: 16.
Source name:
World Development Indicators
Source organization:
United Nations Conference on Trade and Development, Handbook of Statistics and data files, and International Monetary Fund, International Financial Statistics.
Categories, topics:
Private Sector, Trade
Last updated:
apr 23, 2017
Indicators value changes by year
Meaning:
101.58
Minimum:
82.888
jan 1, 2014
Maximum:
127.104
jan 1, 2009
At the date of observation
Value
Absolute change
Change from the previous value
jan 1, 2001
100.0
+100.0
0.0%
jan 1, 2002
96.694
-3.306
-3.31%
jan 1, 2003
90.674
-6.02
-6.23%
jan 1, 2004
106.989
+16.315
17.99%
jan 1, 2005
111.411
+4.422
4.13%
jan 1, 2006
106.189
-5.221
-4.69%
jan 1, 2007
113.572
+7.383
6.95%
jan 1, 2008
125.837
+12.264
10.8%
jan 1, 2009
127.104
+1.267
1.01%
jan 1, 2010
110.117
-16.986
-13.36%
jan 1, 2011
101.604
-8.513
-7.73%
jan 1, 2012
88.259
-13.345
-13.13%
jan 1, 2013
84.721
-3.538
-4.01%
jan 1, 2014
82.888
-1.833
-2.16%
jan 1, 2015
88.524
+5.637
6.8%
jan 1, 2016
90.698
+2.173
2.45%
Ranking of countries by current statistics by years