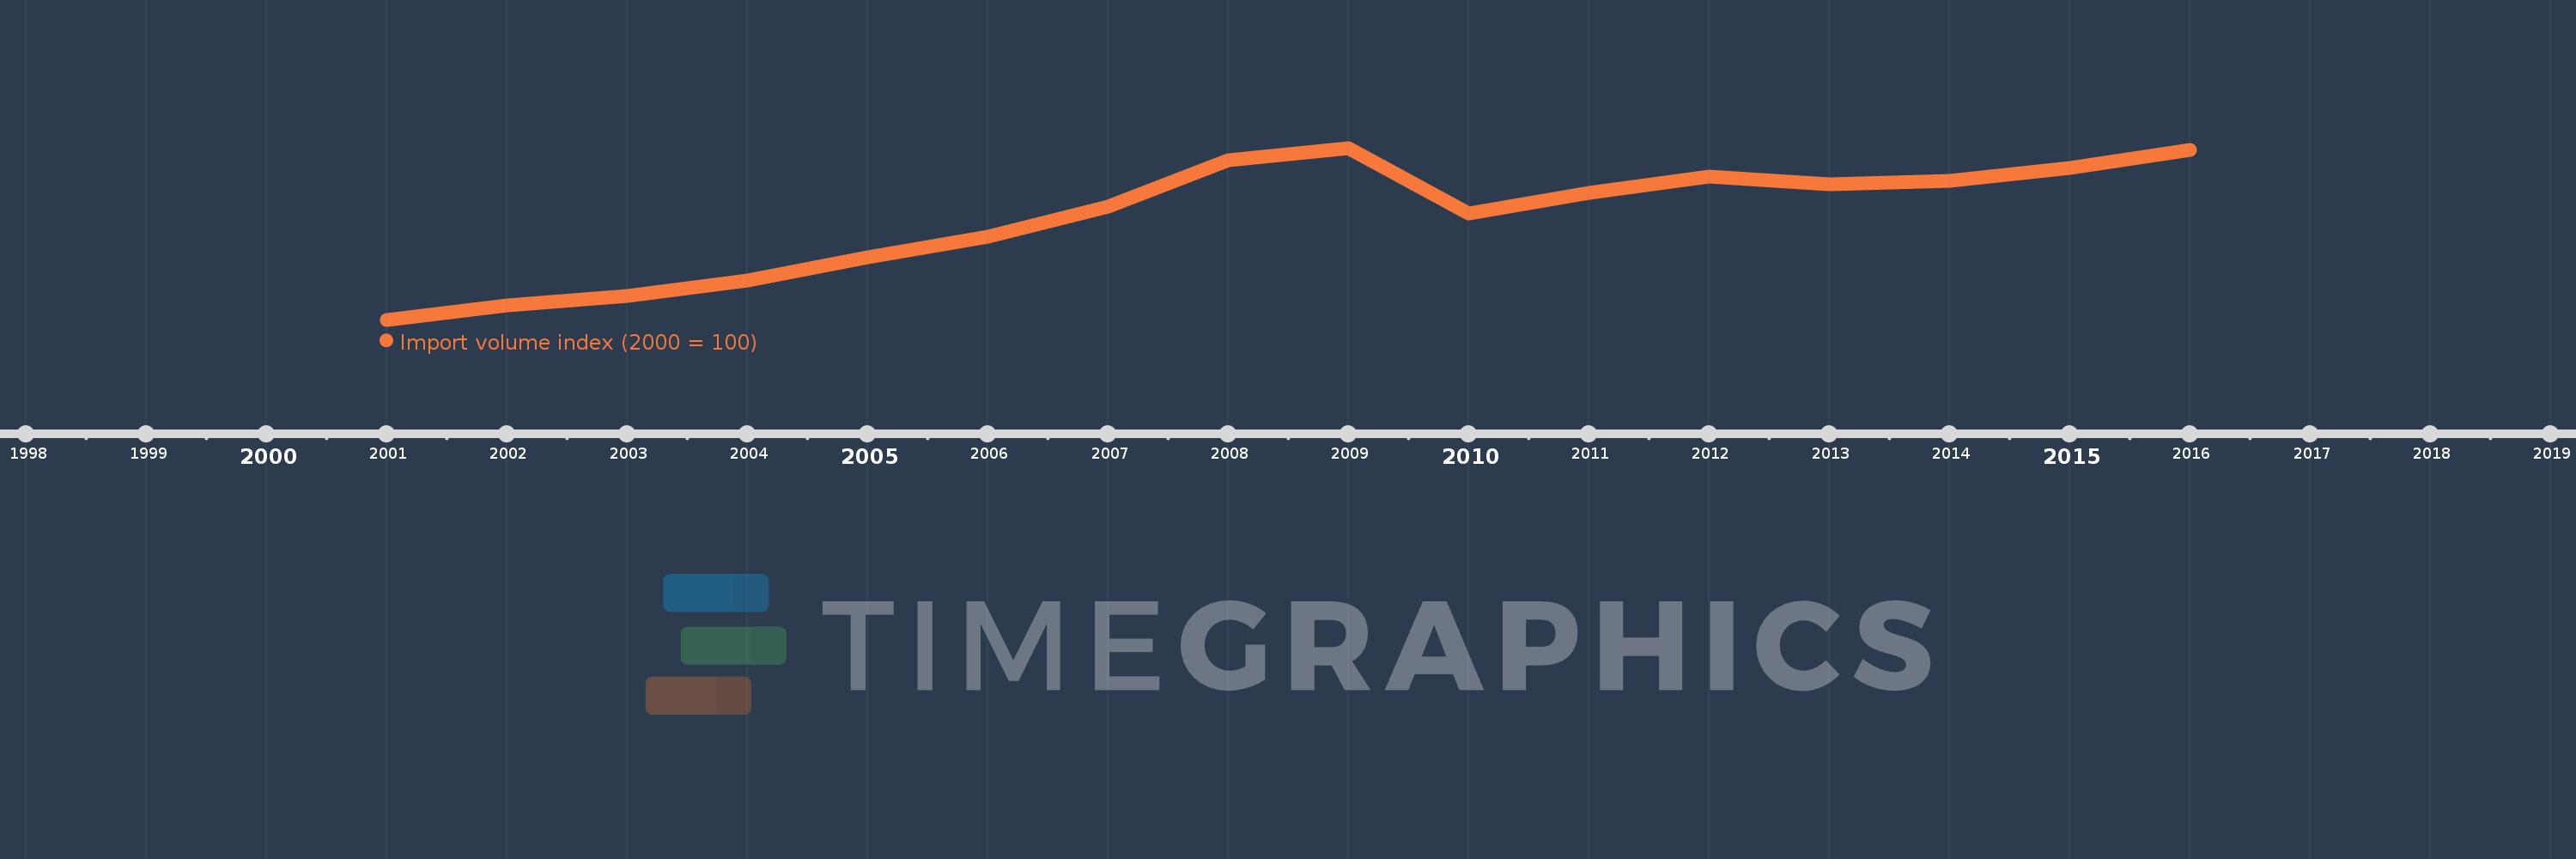
This timeline shows a graph from 2001 to 2016 of Romania. No data until 2000. Number of actual observations by date: 16.
Source name:
World Development Indicators
Source organization:
United Nations Conference on Trade and Development, Handbook of Statistics and data files, and International Monetary Fund, International Financial Statistics.
Categories, topics:
Private Sector, Trade
Last updated:
apr 23, 2017
Indicators value changes by year
Meaning:
233.895
Minimum:
100.0
jan 1, 2001
Maximum:
324.396
jan 1, 2009
At the date of observation
Value
Absolute change
Change from the previous value
jan 1, 2001
100.0
+100.0
0.0%
jan 1, 2002
118.833
+18.833
18.83%
jan 1, 2003
130.993
+12.16
10.23%
jan 1, 2004
150.767
+19.774
15.1%
jan 1, 2005
181.796
+31.03
20.58%
jan 1, 2006
208.258
+26.462
14.56%
jan 1, 2007
247.836
+39.578
19.0%
jan 1, 2008
308.568
+60.732
24.51%
jan 1, 2009
324.396
+15.828
5.13%
jan 1, 2010
238.408
-85.988
-26.51%
jan 1, 2011
266.174
+27.766
11.65%
jan 1, 2012
287.016
+20.841
7.83%
jan 1, 2013
276.668
-10.348
-3.61%
jan 1, 2014
281.728
+5.06
1.83%
jan 1, 2015
298.742
+17.014
6.04%
jan 1, 2016
322.133
+23.391
7.83%
Ranking of countries by current statistics by years