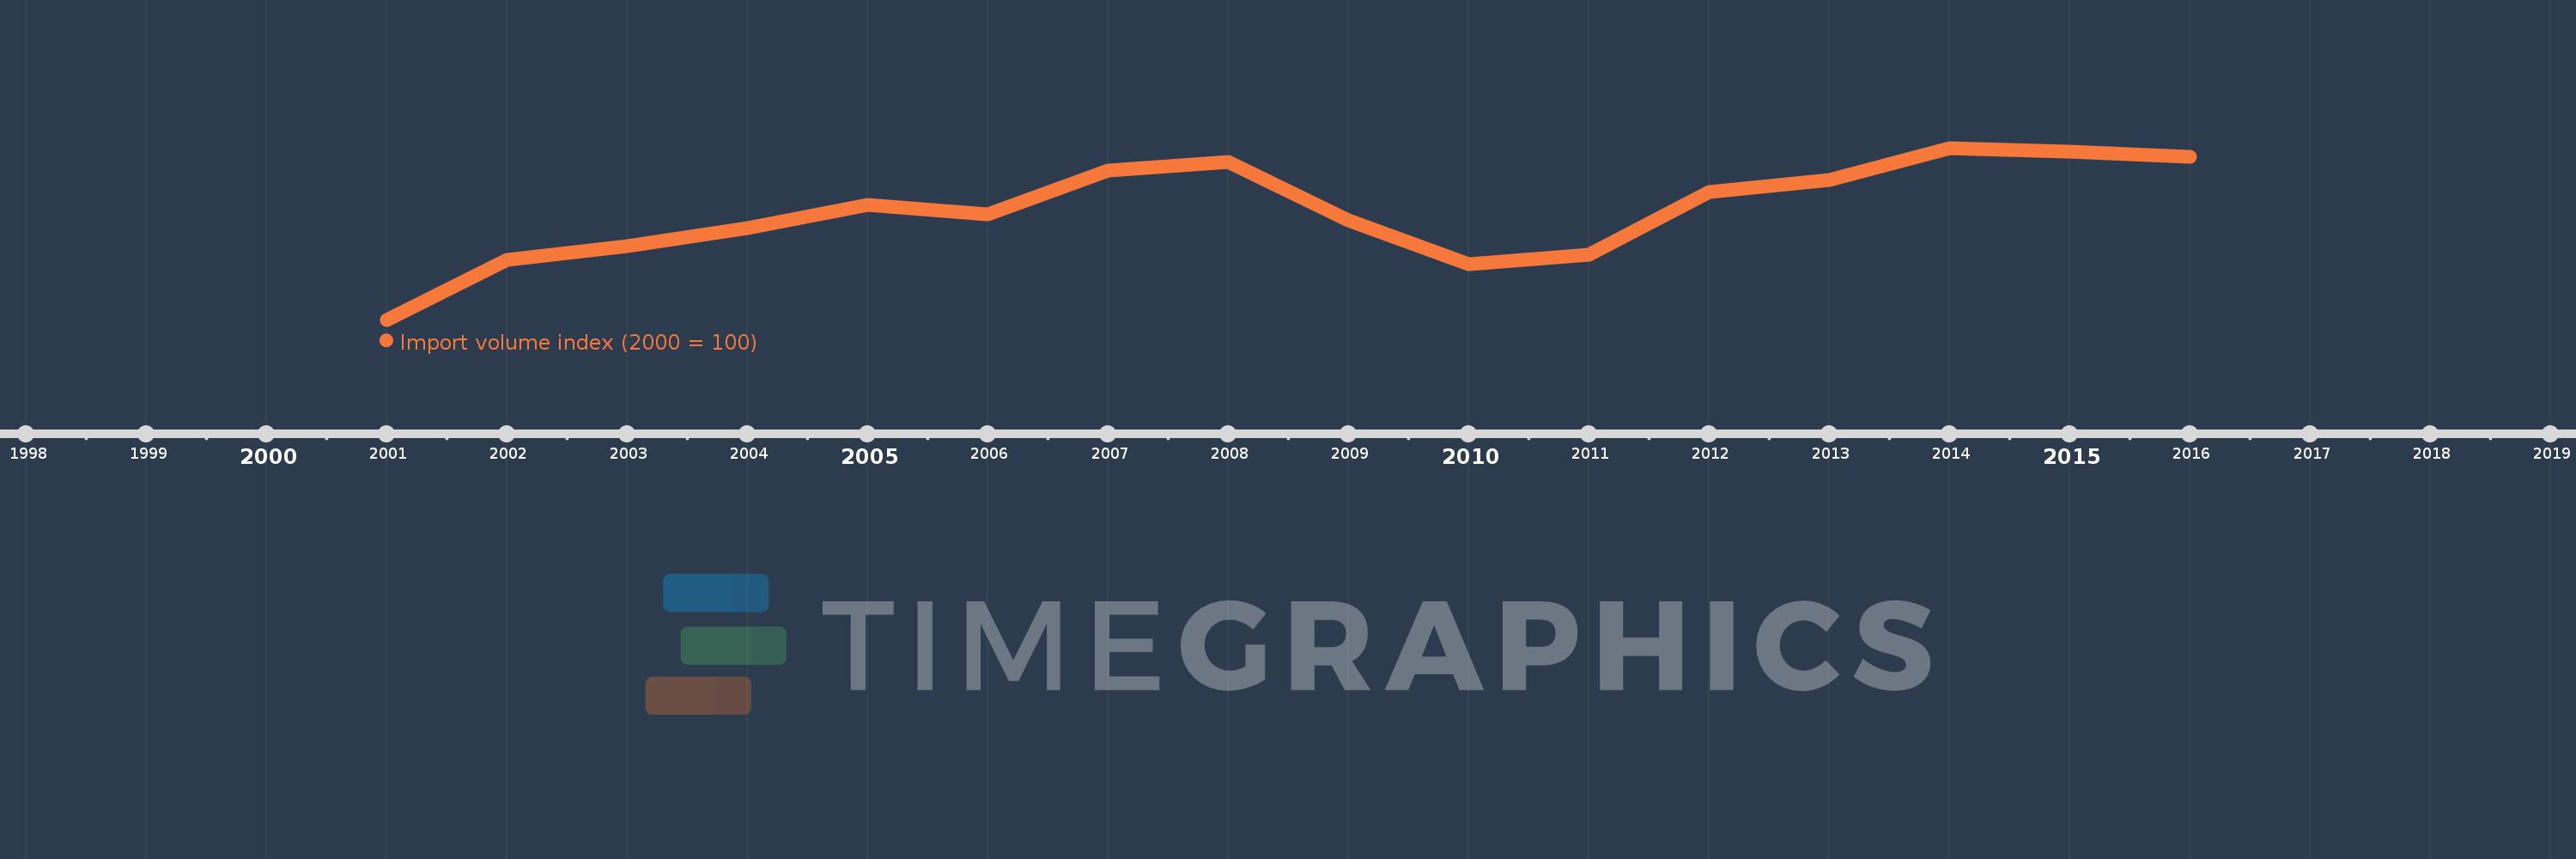
This timeline shows a graph from 2001 to 2016 of Somalia. No data until 2000. Number of actual observations by date: 16.
Source name:
World Development Indicators
Source organization:
United Nations Conference on Trade and Development, Handbook of Statistics and data files, and International Monetary Fund, International Financial Statistics.
Categories, topics:
Private Sector, Trade
Last updated:
apr 23, 2017
Indicators value changes by year
Meaning:
157.984
Minimum:
100.0
jan 1, 2001
Maximum:
191.517
jan 1, 2014
At the date of observation
Value
Absolute change
Change from the previous value
jan 1, 2001
100.0
+100.0
0.0%
jan 1, 2002
132.06
+32.06
32.06%
jan 1, 2003
139.013
+6.952
5.26%
jan 1, 2004
148.61
+9.597
6.9%
jan 1, 2005
161.025
+12.415
8.35%
jan 1, 2006
156.171
-4.855
-3.01%
jan 1, 2007
179.666
+23.495
15.04%
jan 1, 2008
184.243
+4.577
2.55%
jan 1, 2009
152.735
-31.508
-17.1%
jan 1, 2010
129.485
-23.25
-15.22%
jan 1, 2011
134.61
+5.126
3.96%
jan 1, 2012
168.134
+33.524
24.9%
jan 1, 2013
174.348
+6.214
3.7%
jan 1, 2014
191.517
+17.169
9.85%
jan 1, 2015
189.34
-2.177
-1.14%
jan 1, 2016
186.784
-2.556
-1.35%
Ranking of countries by current statistics by years