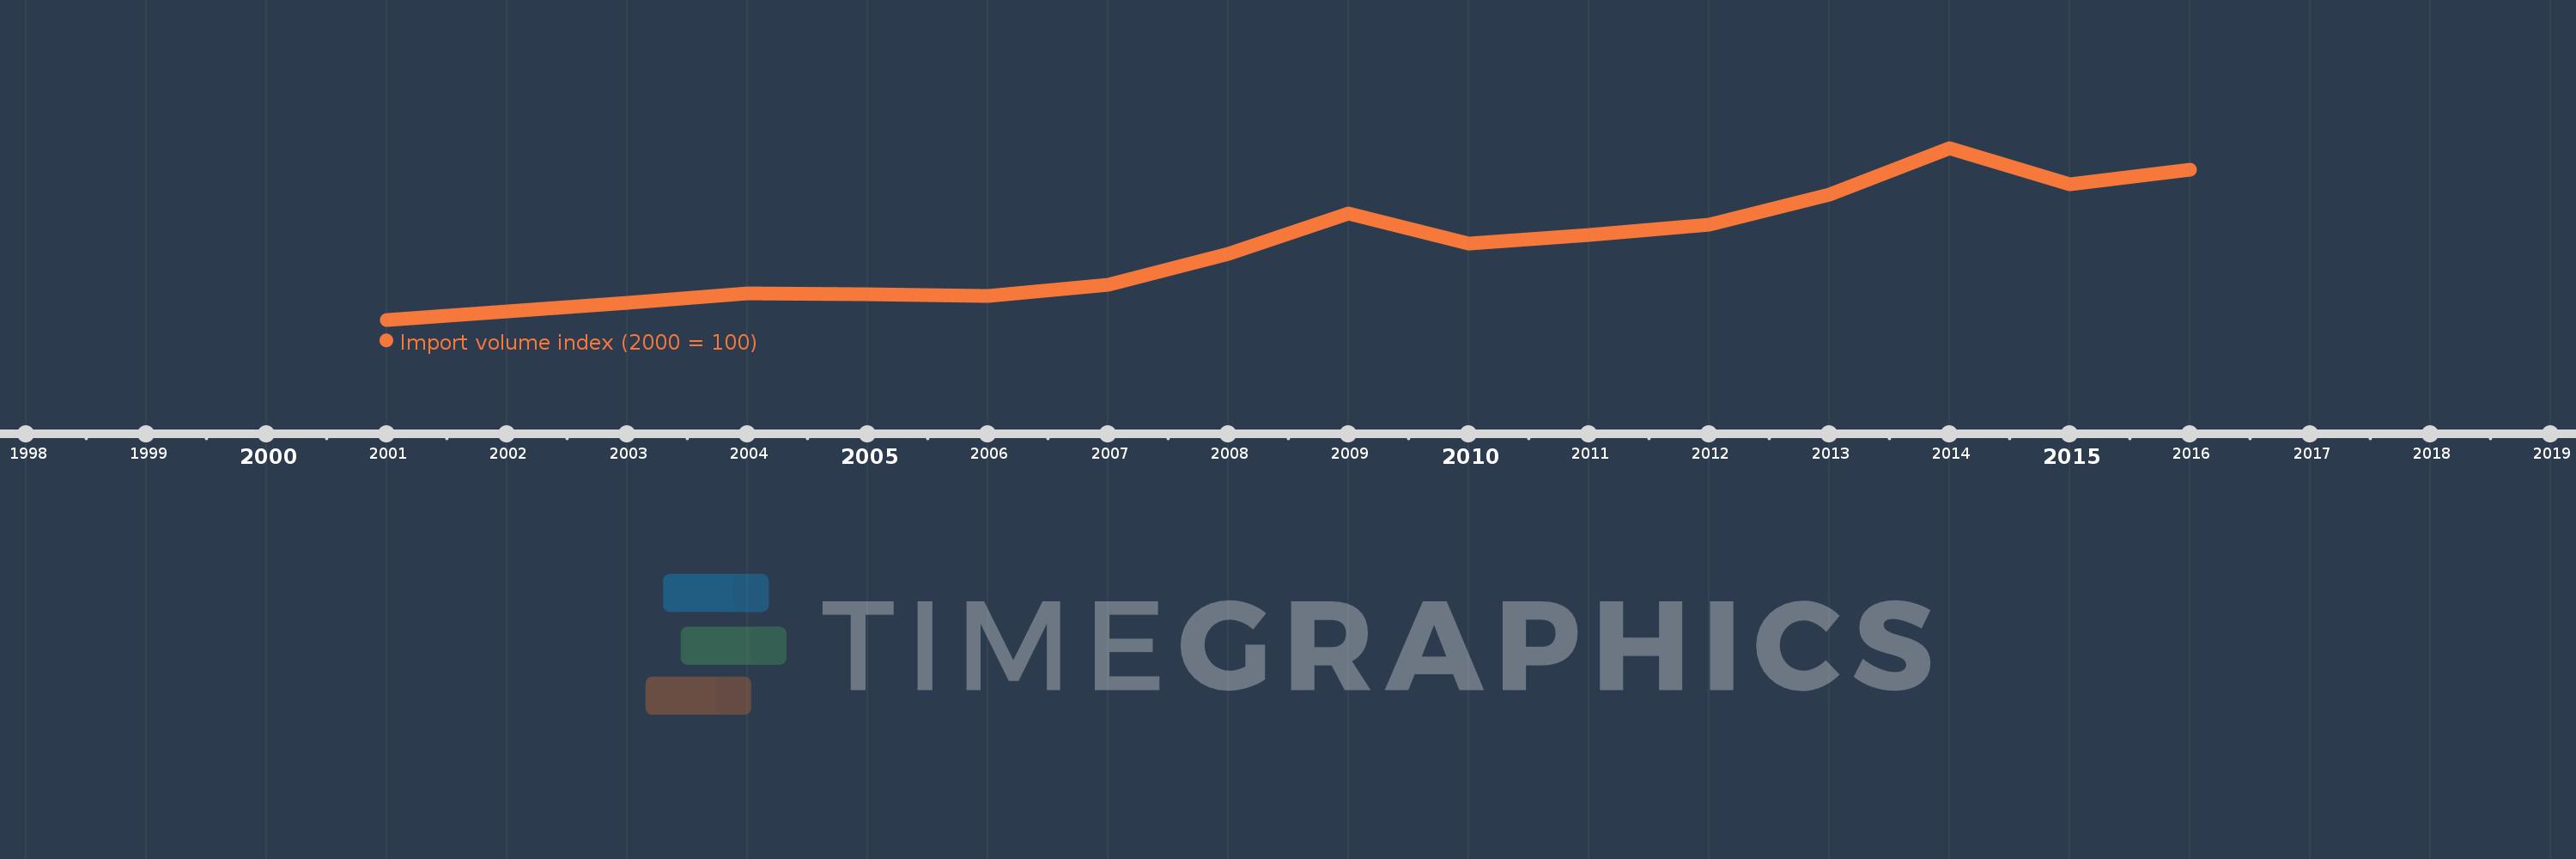
This timeline shows a graph from 2001 to 2016 of Oman. No data until 2000. Number of actual observations by date: 16.
Source name:
World Development Indicators
Source organization:
United Nations Conference on Trade and Development, Handbook of Statistics and data files, and International Monetary Fund, International Financial Statistics.
Categories, topics:
Private Sector, Trade
Last updated:
apr 23, 2017
Indicators value changes by year
Meaning:
236.021
Minimum:
100.0
jan 1, 2001
Maximum:
426.048
jan 1, 2014
At the date of observation
Value
Absolute change
Change from the previous value
jan 1, 2001
100.0
+100.0
0.0%
jan 1, 2002
115.879
+15.879
15.88%
jan 1, 2003
131.352
+15.473
13.35%
jan 1, 2004
149.281
+17.928
13.65%
jan 1, 2005
149.113
-0.168
-0.11%
jan 1, 2006
144.601
-4.512
-3.03%
jan 1, 2007
166.92
+22.319
15.44%
jan 1, 2008
225.475
+58.555
35.08%
jan 1, 2009
302.218
+76.743
34.04%
jan 1, 2010
245.103
-57.115
-18.9%
jan 1, 2011
260.401
+15.298
6.24%
jan 1, 2012
280.035
+19.634
7.54%
jan 1, 2013
338.245
+58.21
20.79%
jan 1, 2014
426.048
+87.803
25.96%
jan 1, 2015
356.569
-69.479
-16.31%
jan 1, 2016
385.094
+28.525
8.0%
Ranking of countries by current statistics by years