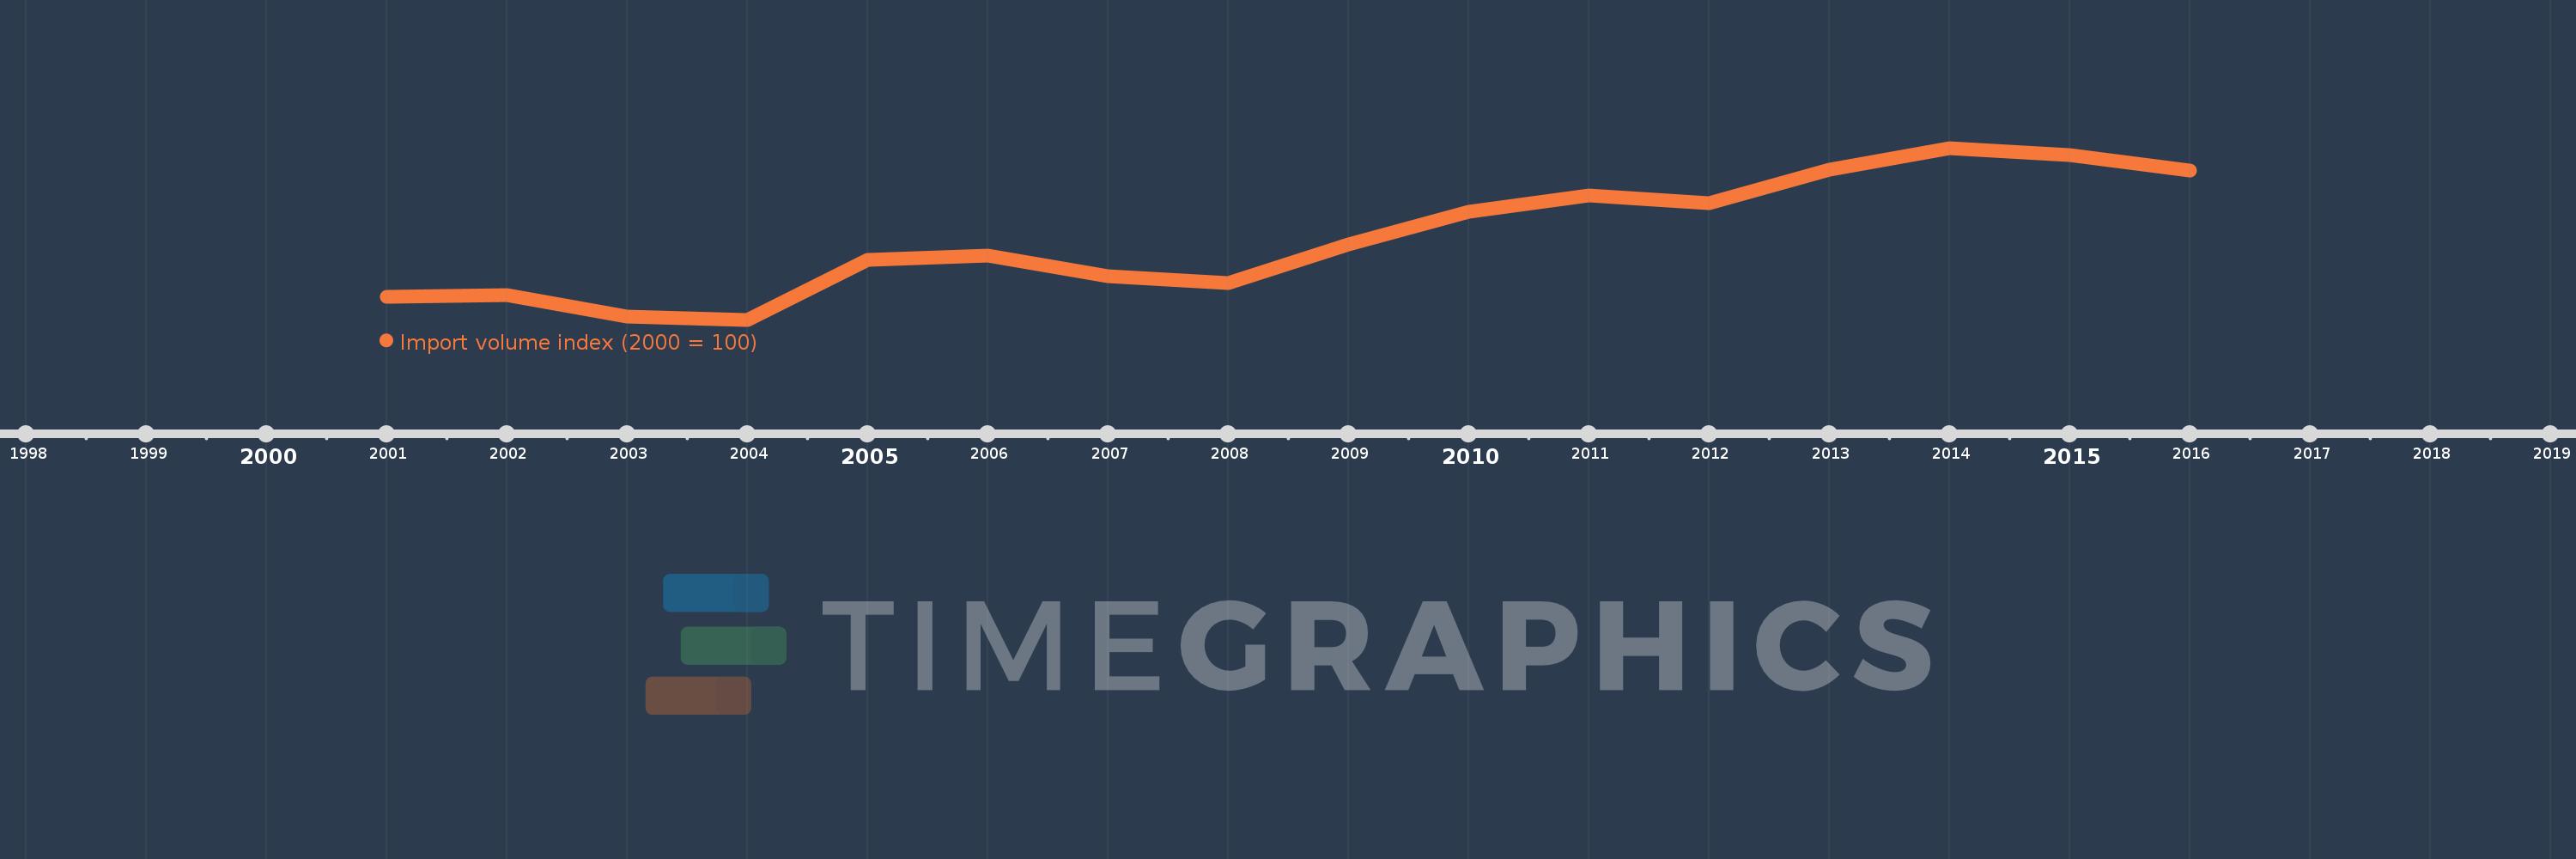
This timeline shows a graph from 2001 to 2016 of Iraq. No data until 2000. Number of actual observations by date: 16.
Source name:
World Development Indicators
Source organization:
United Nations Conference on Trade and Development, Handbook of Statistics and data files, and International Monetary Fund, International Financial Statistics.
Categories, topics:
Private Sector, Trade
Last updated:
apr 23, 2017
Indicators value changes by year
Meaning:
168.484
Minimum:
73.056
jan 1, 2004
Maximum:
272.434
jan 1, 2014
At the date of observation
Value
Absolute change
Change from the previous value
jan 1, 2001
100.0
+100.0
0.0%
jan 1, 2002
101.553
+1.553
1.55%
jan 1, 2003
76.599
-24.953
-24.57%
jan 1, 2004
73.056
-3.543
-4.63%
jan 1, 2005
142.936
+69.88
95.65%
jan 1, 2006
147.846
+4.91
3.43%
jan 1, 2007
124.063
-23.782
-16.09%
jan 1, 2008
115.733
-8.331
-6.71%
jan 1, 2009
160.202
+44.47
38.42%
jan 1, 2010
197.876
+37.673
23.52%
jan 1, 2011
216.966
+19.09
9.65%
jan 1, 2012
208.818
-8.148
-3.76%
jan 1, 2013
247.129
+38.311
18.35%
jan 1, 2014
272.434
+25.305
10.24%
jan 1, 2015
264.295
-8.139
-2.99%
jan 1, 2016
246.234
-18.06
-6.83%
Ranking of countries by current statistics by years