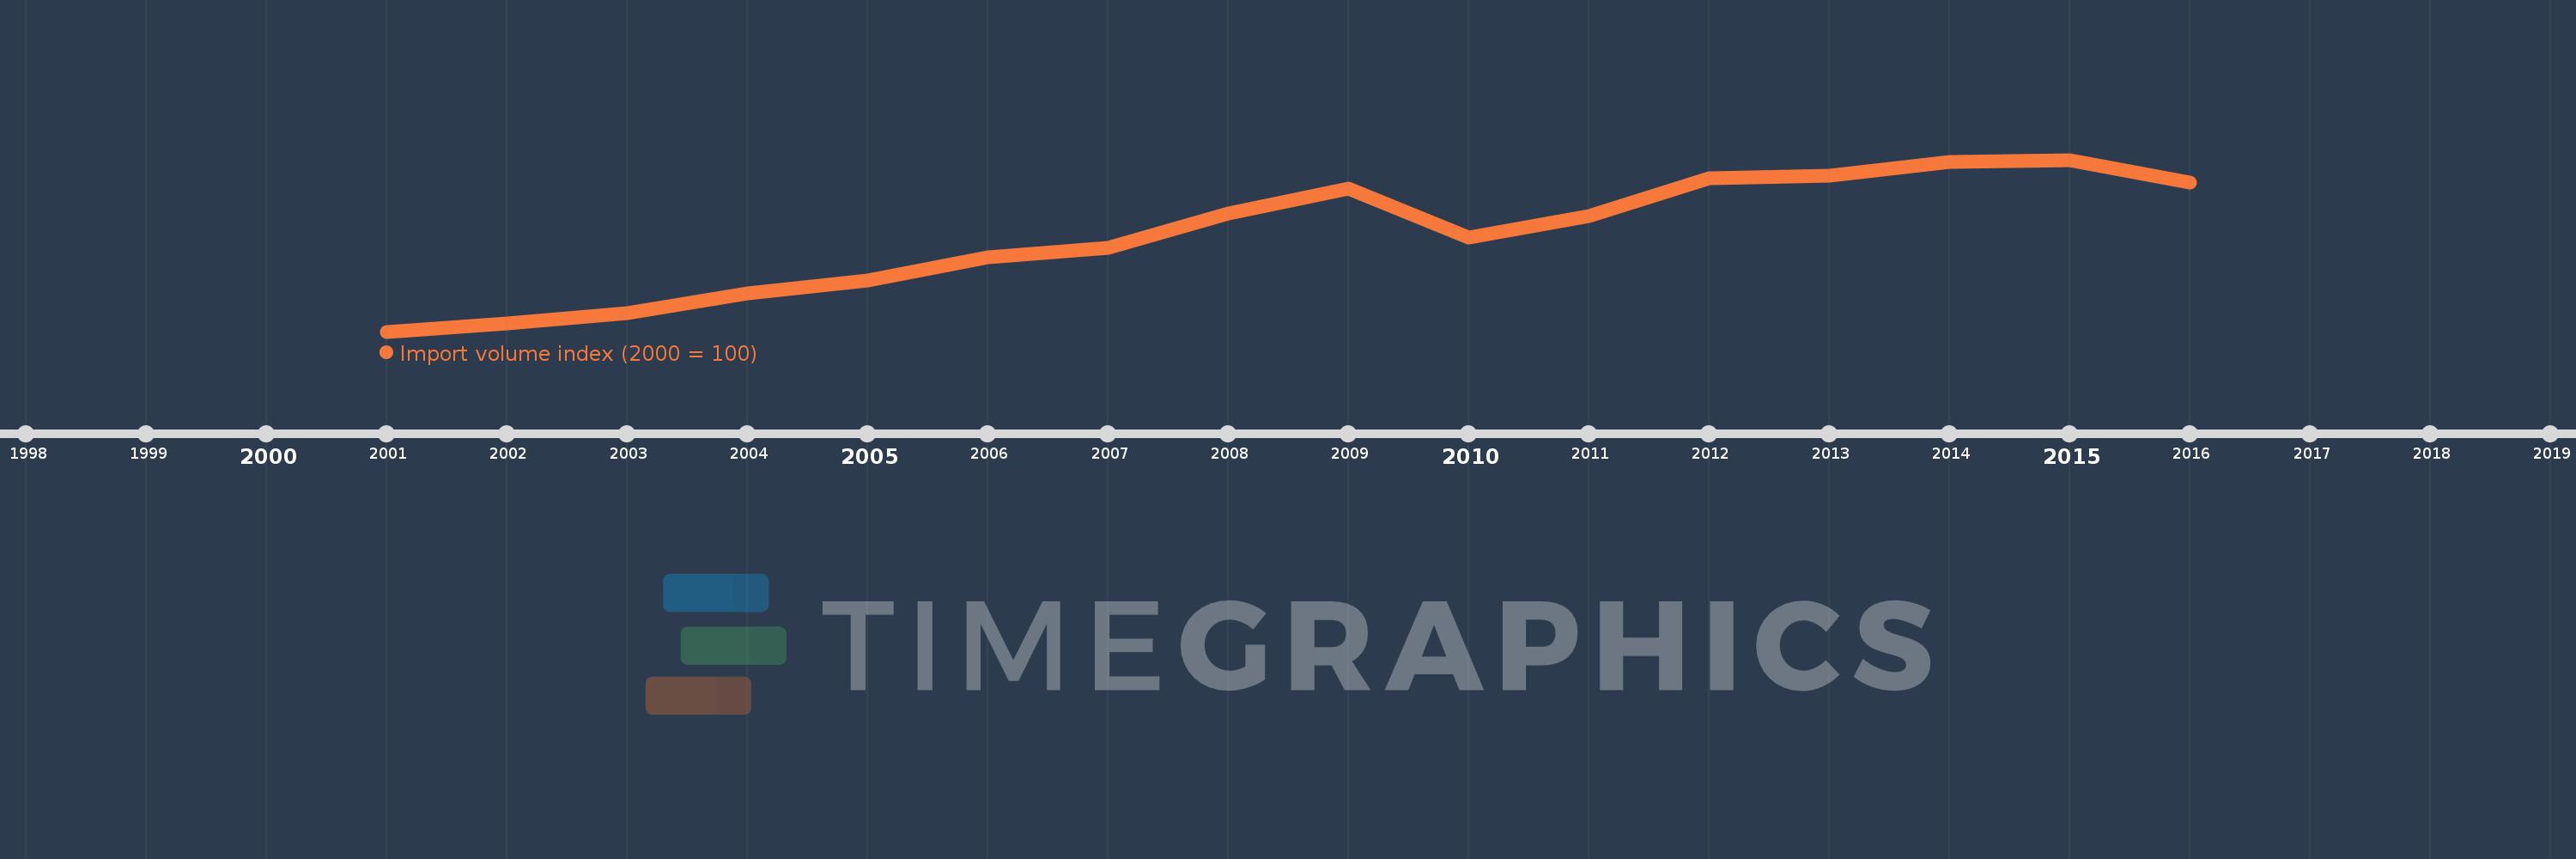
This timeline shows a graph from 2001 to 2016 of Moldova. No data until 2000. Number of actual observations by date: 16.
Source name:
World Development Indicators
Source organization:
United Nations Conference on Trade and Development, Handbook of Statistics and data files, and International Monetary Fund, International Financial Statistics.
Categories, topics:
Private Sector, Trade
Last updated:
apr 23, 2017
Indicators value changes by year
Meaning:
275.427
Minimum:
100.0
jan 1, 2001
Maximum:
411.902
jan 1, 2015
At the date of observation
Value
Absolute change
Change from the previous value
jan 1, 2001
100.0
+100.0
0.0%
jan 1, 2002
114.801
+14.801
14.8%
jan 1, 2003
133.591
+18.79
16.37%
jan 1, 2004
169.811
+36.22
27.11%
jan 1, 2005
193.448
+23.636
13.92%
jan 1, 2006
234.305
+40.857
21.12%
jan 1, 2007
252.582
+18.277
7.8%
jan 1, 2008
314.599
+62.017
24.55%
jan 1, 2009
360.061
+45.461
14.45%
jan 1, 2010
270.735
-89.326
-24.81%
jan 1, 2011
309.114
+38.379
14.18%
jan 1, 2012
378.395
+69.281
22.41%
jan 1, 2013
383.808
+5.413
1.43%
jan 1, 2014
408.471
+24.663
6.43%
jan 1, 2015
411.902
+3.432
0.84%
jan 1, 2016
371.218
-40.685
-9.88%
Ranking of countries by current statistics by years