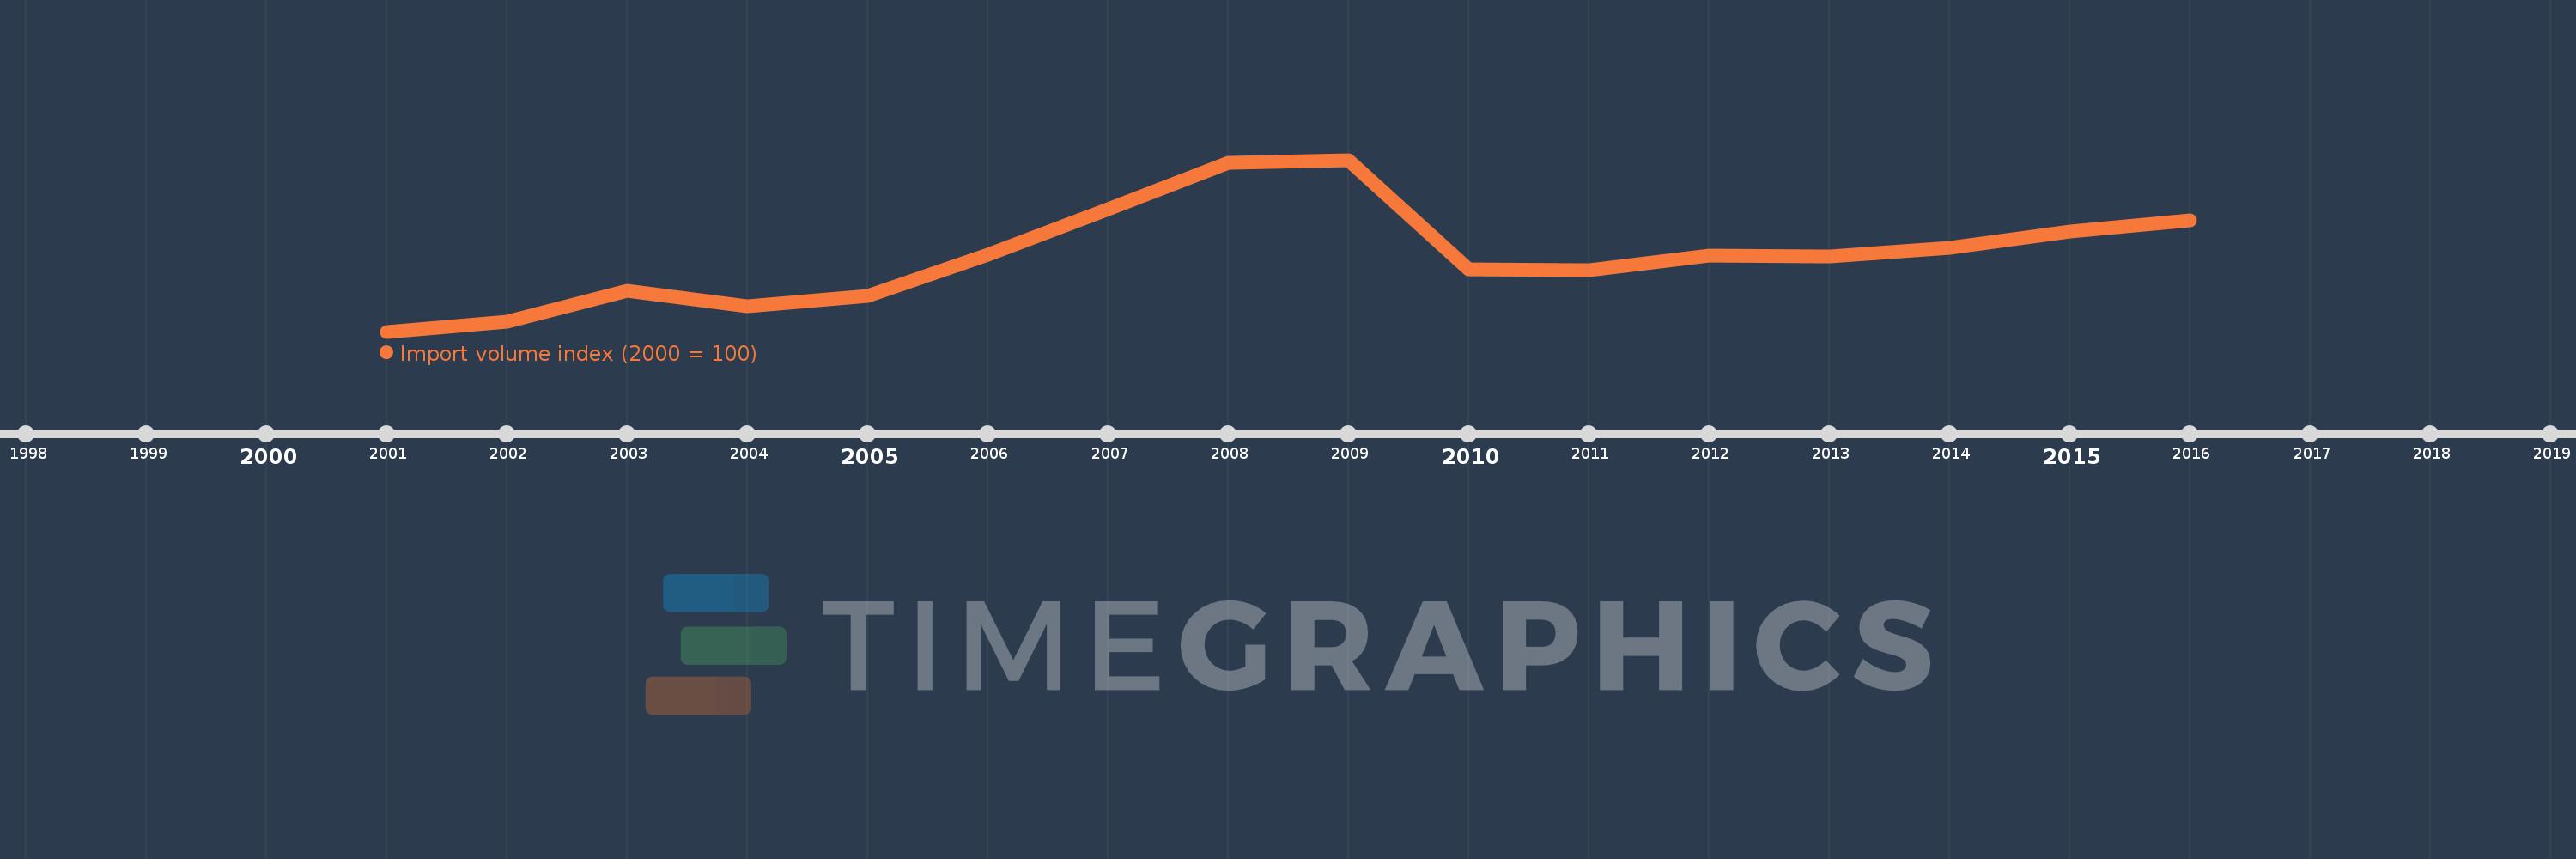
This timeline shows a graph from 2001 to 2016 of Denmark. No data until 2000. Number of actual observations by date: 16.
Source name:
World Development Indicators
Source organization:
United Nations Conference on Trade and Development, Handbook of Statistics and data files, and International Monetary Fund, International Financial Statistics.
Categories, topics:
Private Sector, Trade
Last updated:
apr 23, 2017
Indicators value changes by year
Meaning:
116.73
Minimum:
100.0
jan 1, 2001
Maximum:
137.627
jan 1, 2009
At the date of observation
Value
Absolute change
Change from the previous value
jan 1, 2001
100.0
+100.0
0.0%
jan 1, 2002
102.108
+2.108
2.11%
jan 1, 2003
108.886
+6.778
6.64%
jan 1, 2004
105.525
-3.361
-3.09%
jan 1, 2005
107.779
+2.254
2.14%
jan 1, 2006
116.923
+9.144
8.48%
jan 1, 2007
126.813
+9.89
8.46%
jan 1, 2008
137.059
+10.246
8.08%
jan 1, 2009
137.627
+0.568
0.41%
jan 1, 2010
113.675
-23.952
-17.4%
jan 1, 2011
113.401
-0.275
-0.24%
jan 1, 2012
116.741
+3.34
2.95%
jan 1, 2013
116.454
-0.287
-0.25%
jan 1, 2014
118.412
+1.957
1.68%
jan 1, 2015
121.887
+3.475
2.93%
jan 1, 2016
124.397
+2.51
2.06%
Ranking of countries by current statistics by years