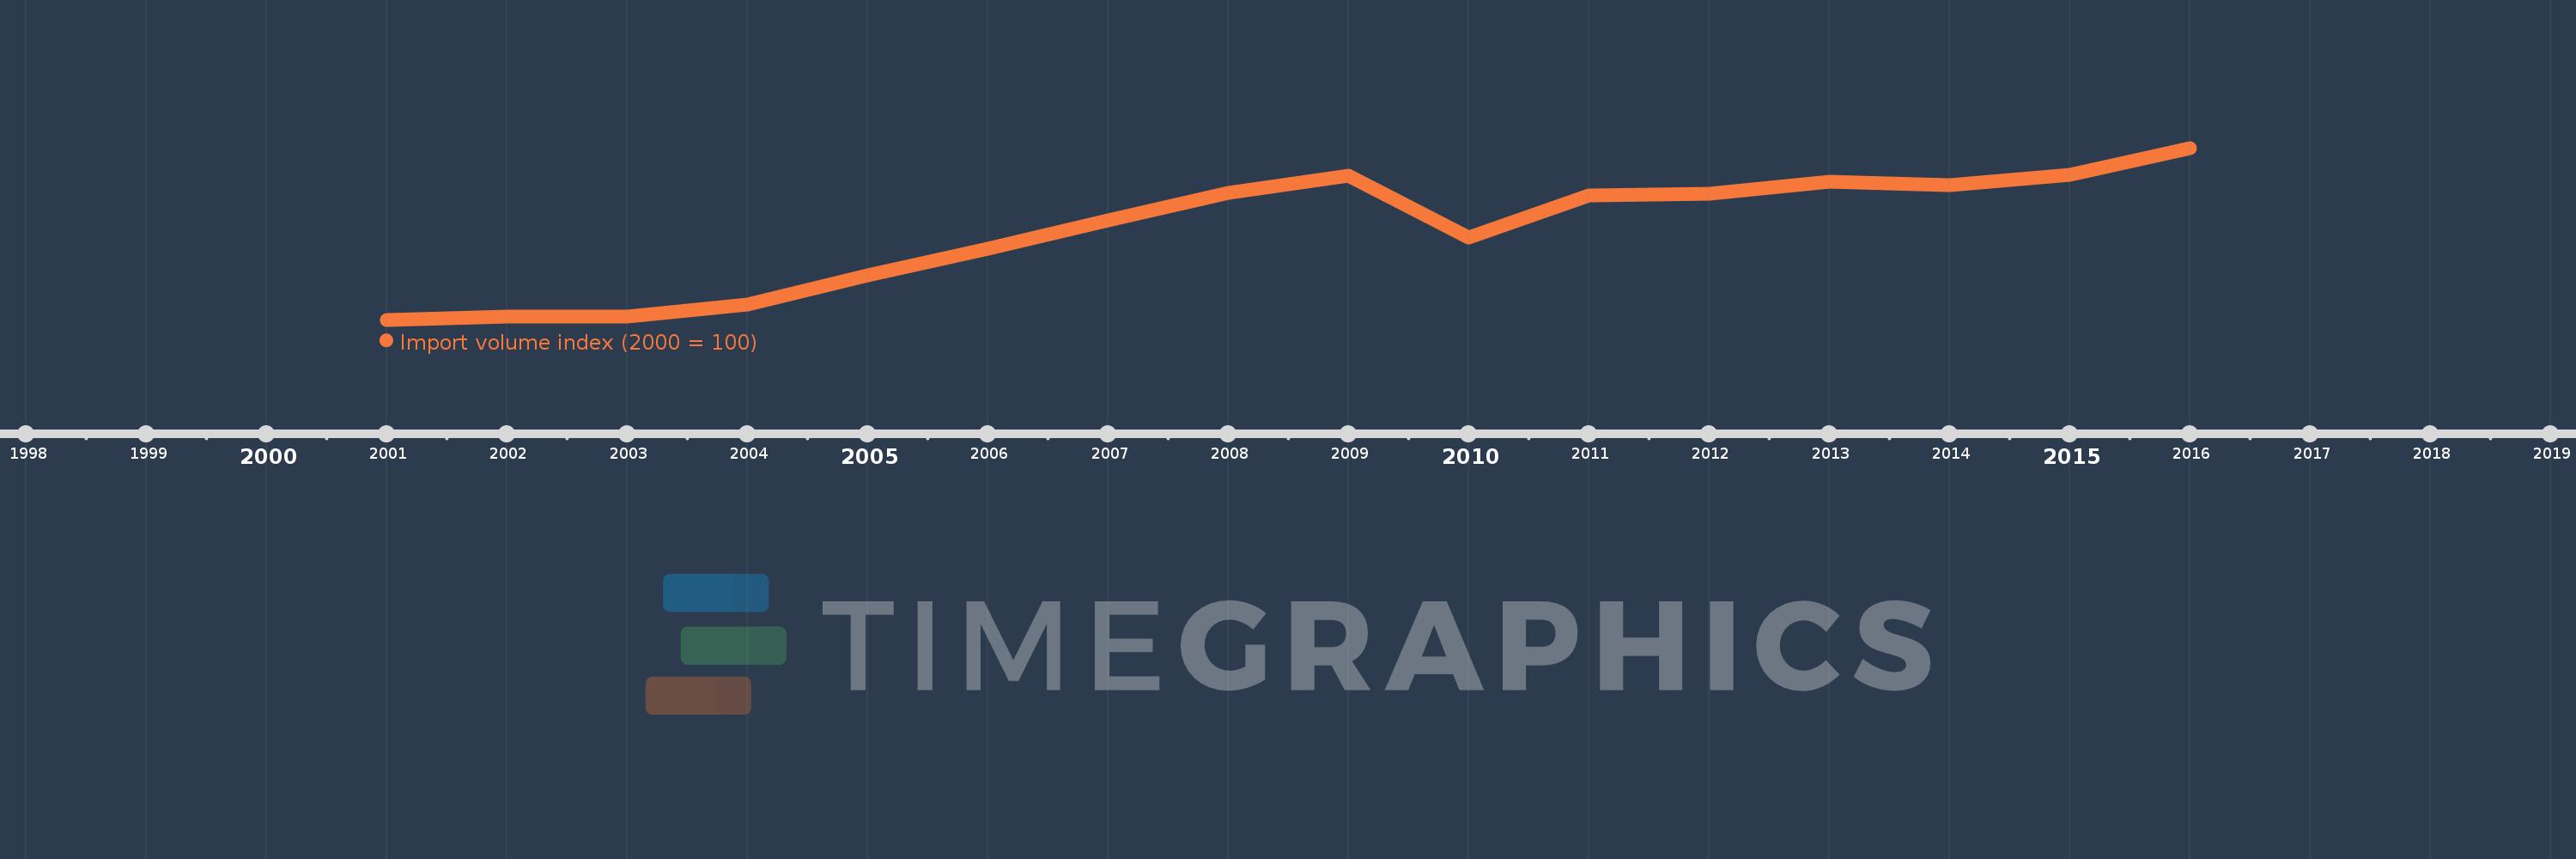
This timeline shows a graph from 2001 to 2016 of Netherlands. No data until 2000. Number of actual observations by date: 16.
Source name:
World Development Indicators
Source organization:
United Nations Conference on Trade and Development, Handbook of Statistics and data files, and International Monetary Fund, International Financial Statistics.
Categories, topics:
Private Sector, Trade
Last updated:
apr 23, 2017
Indicators value changes by year
Meaning:
126.116
Minimum:
100.0
jan 1, 2001
Maximum:
150.24
jan 1, 2016
At the date of observation
Value
Absolute change
Change from the previous value
jan 1, 2001
100.0
+100.0
0.0%
jan 1, 2002
100.983
+0.983
0.98%
jan 1, 2003
100.907
-0.076
-0.08%
jan 1, 2004
104.561
+3.655
3.62%
jan 1, 2005
112.904
+8.343
7.98%
jan 1, 2006
120.869
+7.965
7.05%
jan 1, 2007
129.042
+8.172
6.76%
jan 1, 2008
137.039
+7.997
6.2%
jan 1, 2009
142.026
+4.988
3.64%
jan 1, 2010
124.163
-17.864
-12.58%
jan 1, 2011
136.283
+12.121
9.76%
jan 1, 2012
136.852
+0.569
0.42%
jan 1, 2013
140.301
+3.449
2.52%
jan 1, 2014
139.35
-0.951
-0.68%
jan 1, 2015
142.334
+2.984
2.14%
jan 1, 2016
150.24
+7.907
5.56%
Ranking of countries by current statistics by years