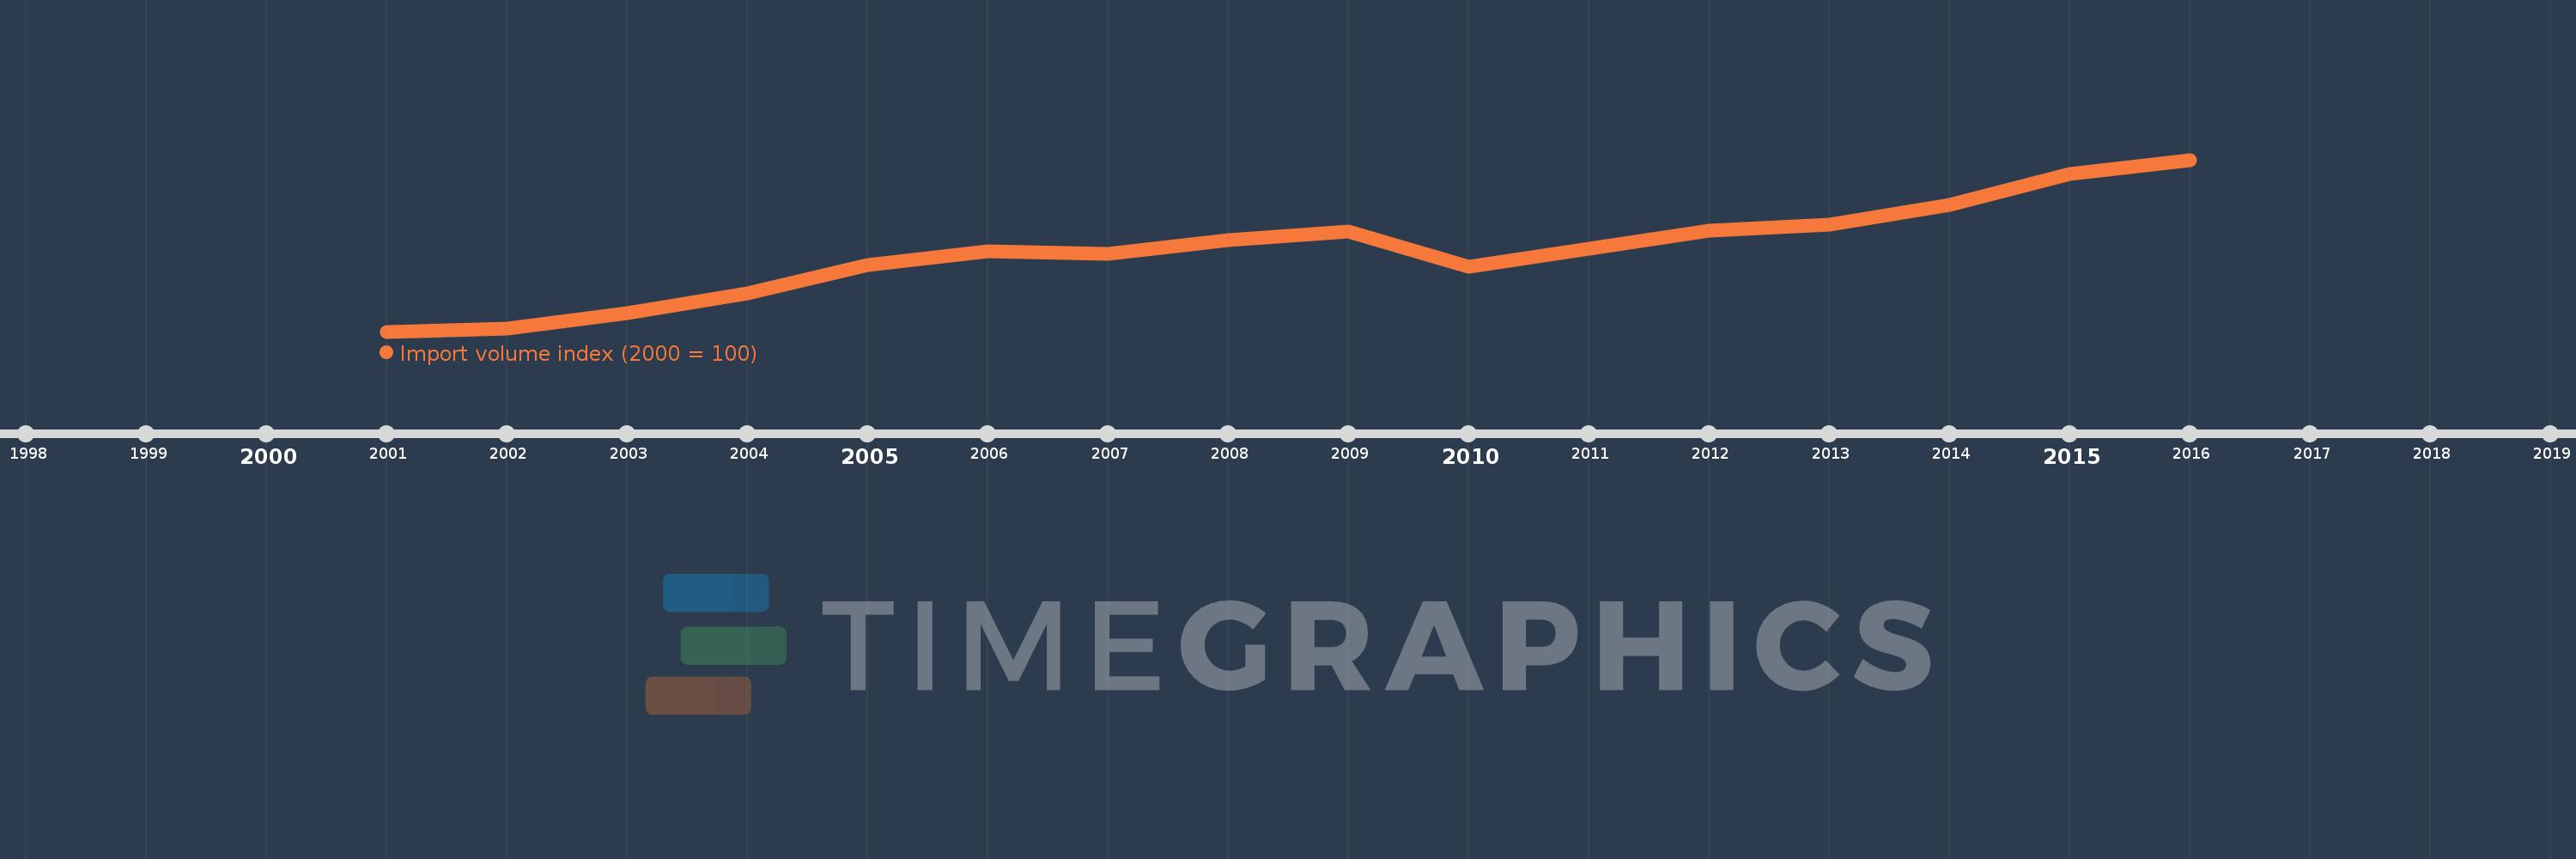
This timeline shows a graph from 2001 to 2016 of New Zealand. No data until 2000. Number of actual observations by date: 16.
Source name:
World Development Indicators
Source organization:
United Nations Conference on Trade and Development, Handbook of Statistics and data files, and International Monetary Fund, International Financial Statistics.
Categories, topics:
Private Sector, Trade
Last updated:
apr 23, 2017
Indicators value changes by year
Meaning:
151.576
Minimum:
100.0
jan 1, 2001
Maximum:
210.084
jan 1, 2016
At the date of observation
Value
Absolute change
Change from the previous value
jan 1, 2001
100.0
+100.0
0.0%
jan 1, 2002
101.82
+1.82
1.82%
jan 1, 2003
111.772
+9.952
9.77%
jan 1, 2004
124.31
+12.538
11.22%
jan 1, 2005
142.665
+18.355
14.77%
jan 1, 2006
151.282
+8.617
6.04%
jan 1, 2007
149.916
-1.366
-0.9%
jan 1, 2008
158.415
+8.498
5.67%
jan 1, 2009
164.309
+5.894
3.72%
jan 1, 2010
141.505
-22.804
-13.88%
jan 1, 2011
153.311
+11.806
8.34%
jan 1, 2012
164.862
+11.551
7.53%
jan 1, 2013
168.45
+3.588
2.18%
jan 1, 2014
181.454
+13.004
7.72%
jan 1, 2015
201.06
+19.606
10.8%
jan 1, 2016
210.084
+9.024
4.49%
Ranking of countries by current statistics by years