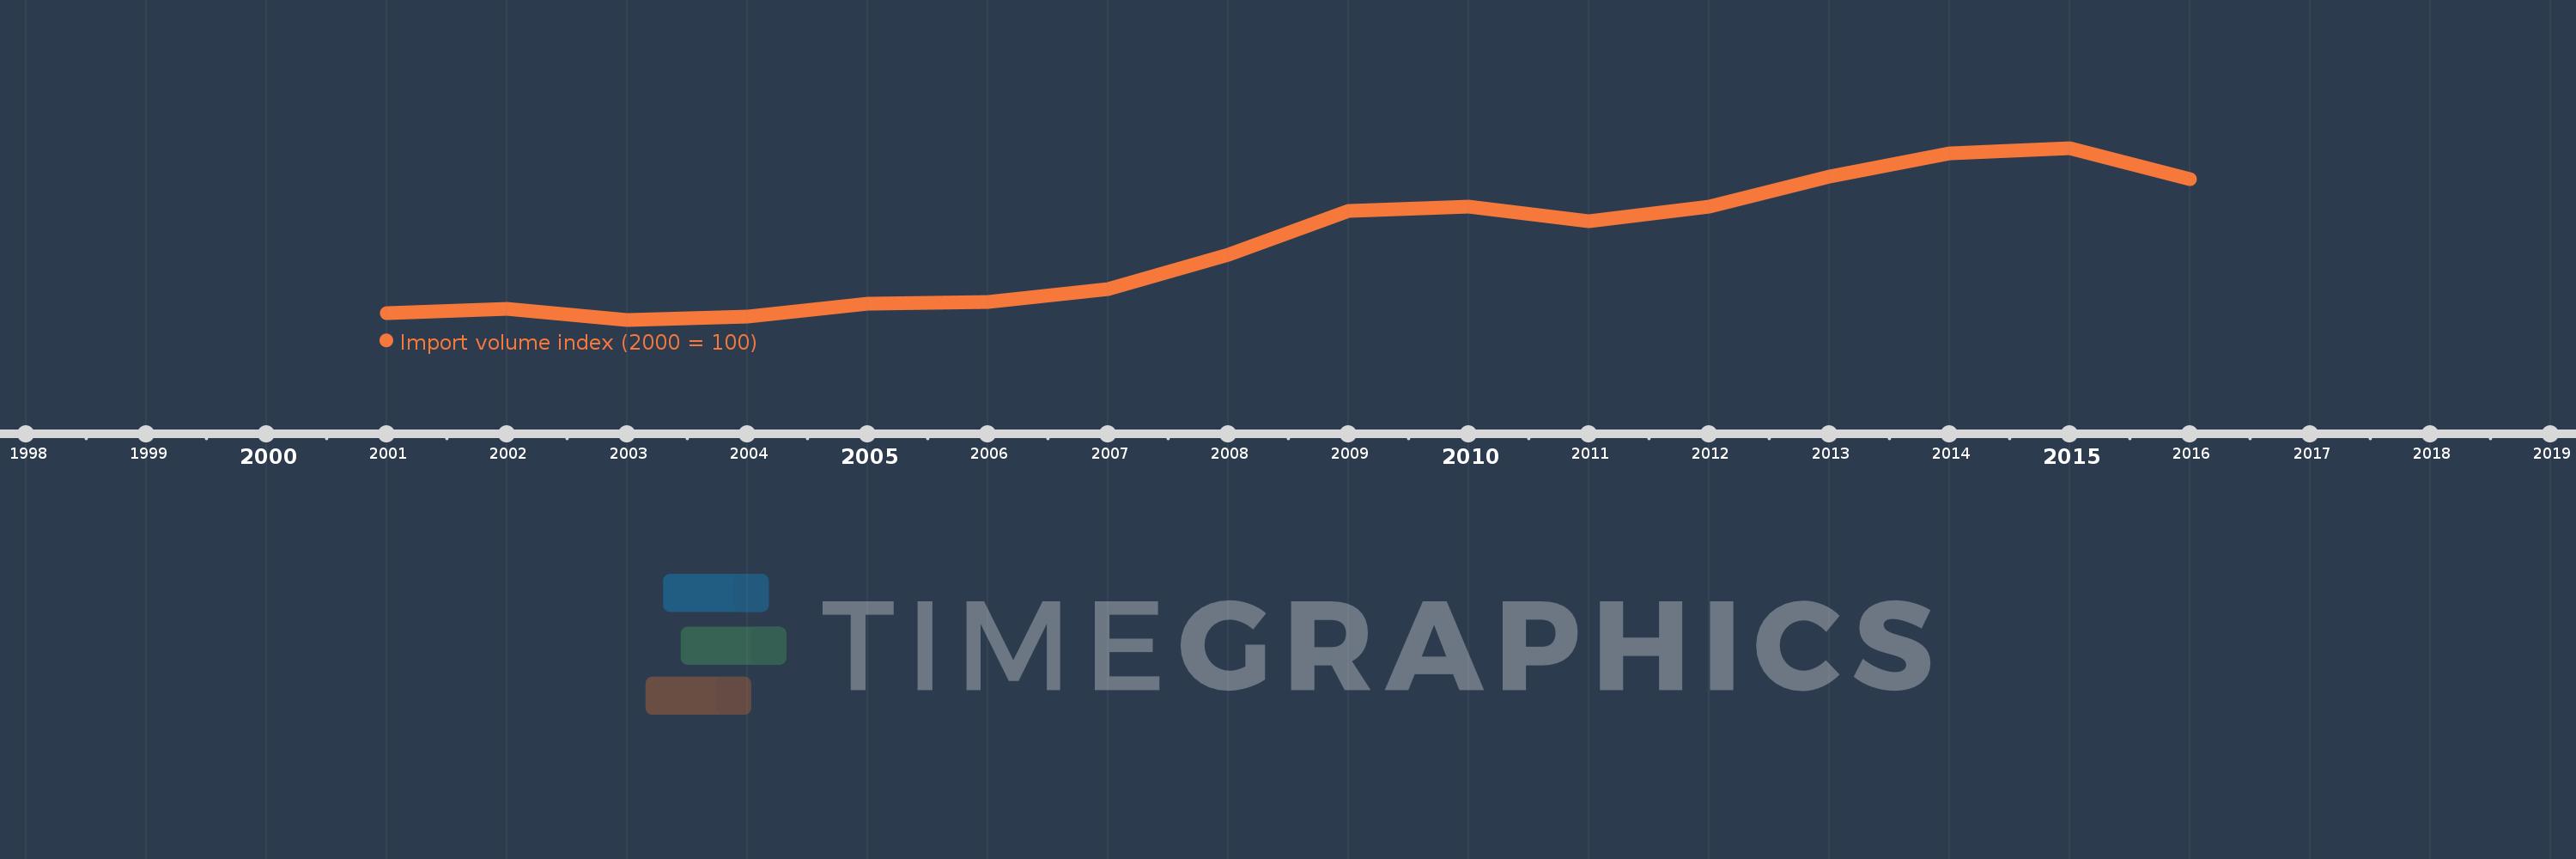
This timeline shows a graph from 2001 to 2016 of Uzbekistan. No data until 2000. Number of actual observations by date: 16.
Source name:
World Development Indicators
Source organization:
United Nations Conference on Trade and Development, Handbook of Statistics and data files, and International Monetary Fund, International Financial Statistics.
Categories, topics:
Private Sector, Trade
Last updated:
apr 23, 2017
Indicators value changes by year
Meaning:
188.255
Minimum:
90.918
jan 1, 2003
Maximum:
312.863
jan 1, 2015
At the date of observation
Value
Absolute change
Change from the previous value
jan 1, 2001
100.0
+100.0
0.0%
jan 1, 2002
105.45
+5.45
5.45%
jan 1, 2003
90.918
-14.532
-13.78%
jan 1, 2004
94.488
+3.57
3.93%
jan 1, 2005
111.277
+16.789
17.77%
jan 1, 2006
113.822
+2.545
2.29%
jan 1, 2007
130.06
+16.238
14.27%
jan 1, 2008
174.968
+44.908
34.53%
jan 1, 2009
231.868
+56.9
32.52%
jan 1, 2010
236.749
+4.881
2.11%
jan 1, 2011
218.137
-18.612
-7.86%
jan 1, 2012
237.559
+19.422
8.9%
jan 1, 2013
275.701
+38.142
16.06%
jan 1, 2014
305.707
+30.006
10.88%
jan 1, 2015
312.863
+7.156
2.34%
jan 1, 2016
272.507
-40.356
-12.9%
Ranking of countries by current statistics by years