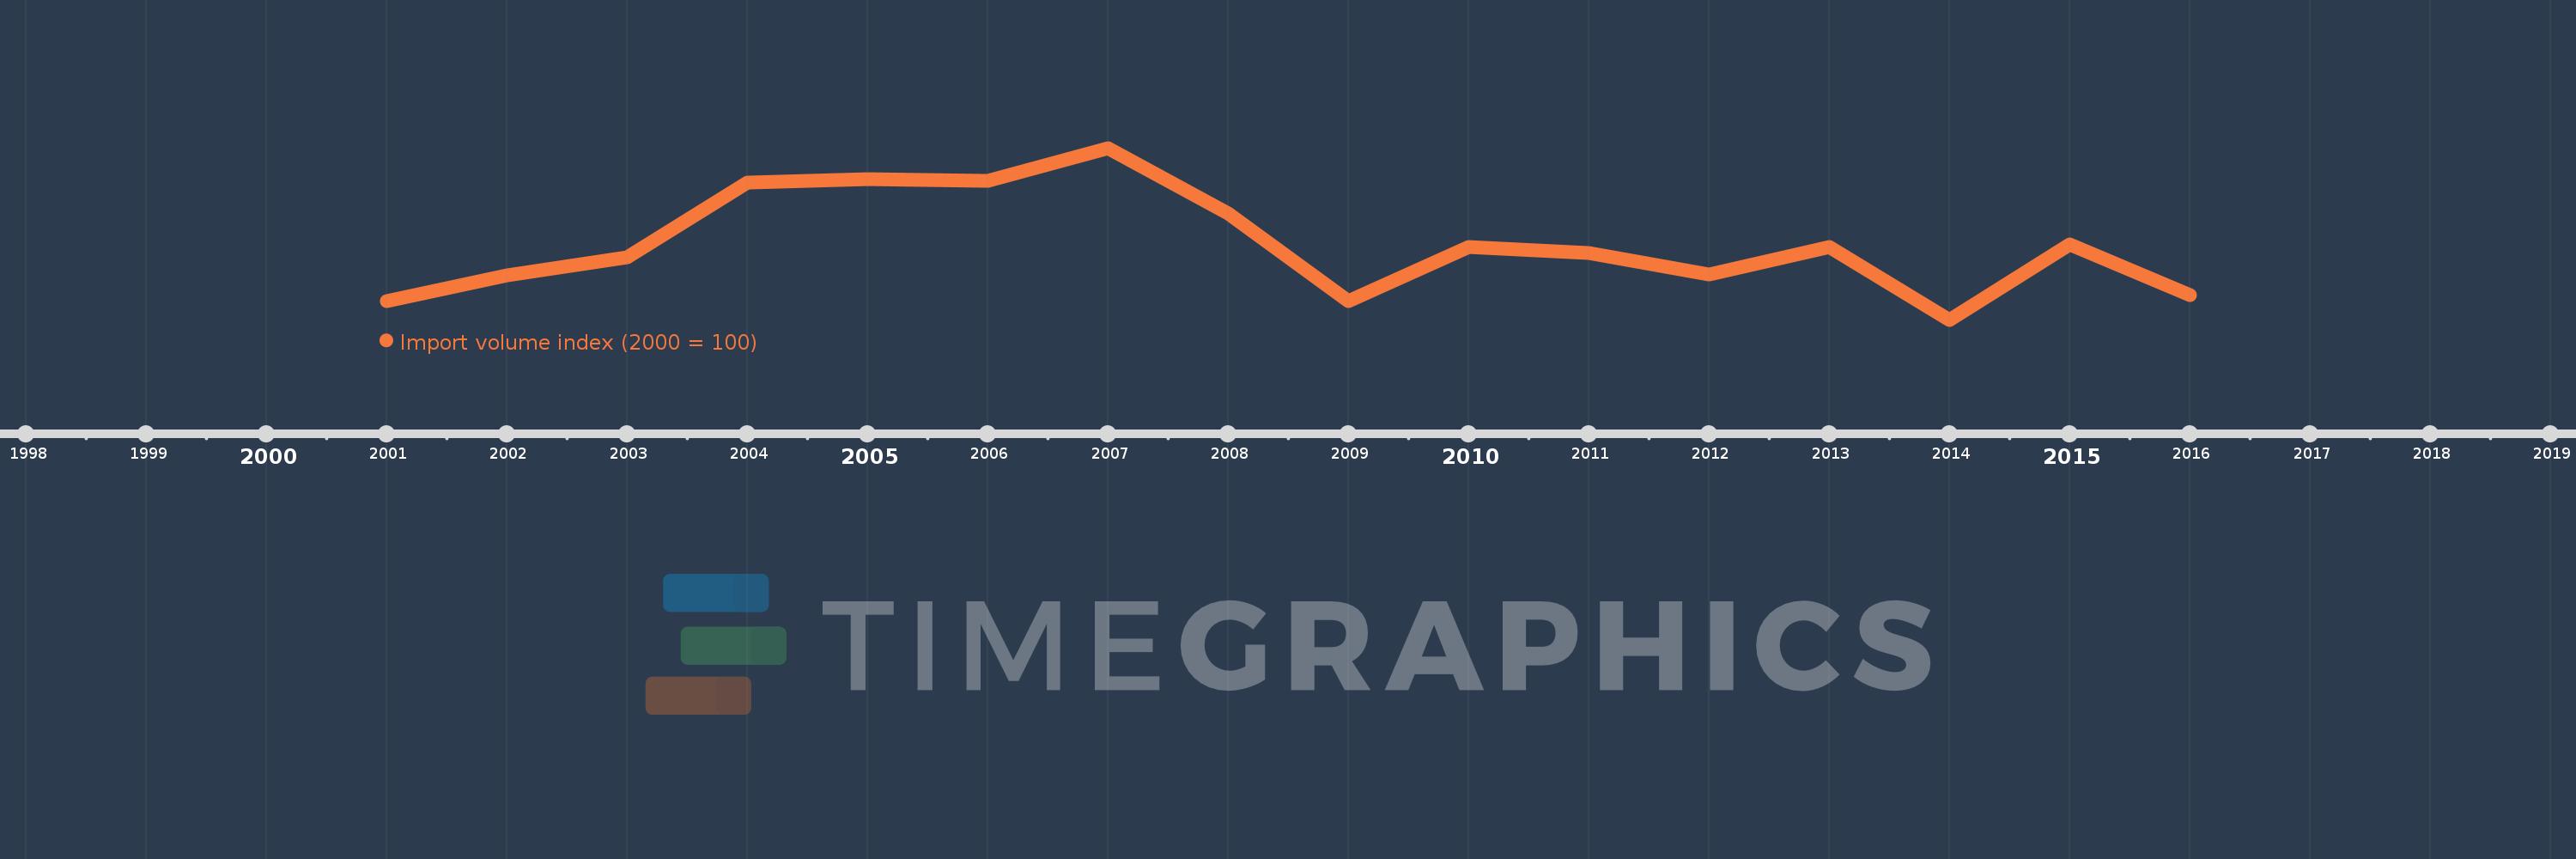
This timeline shows a graph from 2001 to 2016 of Guam. No data until 2000. Number of actual observations by date: 16.
Source name:
World Development Indicators
Source organization:
United Nations Conference on Trade and Development, Handbook of Statistics and data files, and International Monetary Fund, International Financial Statistics.
Categories, topics:
Private Sector, Trade
Last updated:
apr 23, 2017
Indicators value changes by year
Meaning:
120.33
Minimum:
93.194
jan 1, 2014
Maximum:
155.594
jan 1, 2007
At the date of observation
Value
Absolute change
Change from the previous value
jan 1, 2001
100.0
+100.0
0.0%
jan 1, 2002
109.41
+9.41
9.41%
jan 1, 2003
115.956
+6.546
5.98%
jan 1, 2004
142.909
+26.952
23.24%
jan 1, 2005
144.152
+1.243
0.87%
jan 1, 2006
143.578
-0.574
-0.4%
jan 1, 2007
155.594
+12.016
8.37%
jan 1, 2008
131.852
-23.742
-15.26%
jan 1, 2009
99.823
-32.029
-24.29%
jan 1, 2010
119.491
+19.669
19.7%
jan 1, 2011
117.48
-2.012
-1.68%
jan 1, 2012
109.633
-7.847
-6.68%
jan 1, 2013
119.615
+9.982
9.11%
jan 1, 2014
93.194
-26.42
-22.09%
jan 1, 2015
120.536
+27.342
29.34%
jan 1, 2016
102.058
-18.478
-15.33%
Ranking of countries by current statistics by years