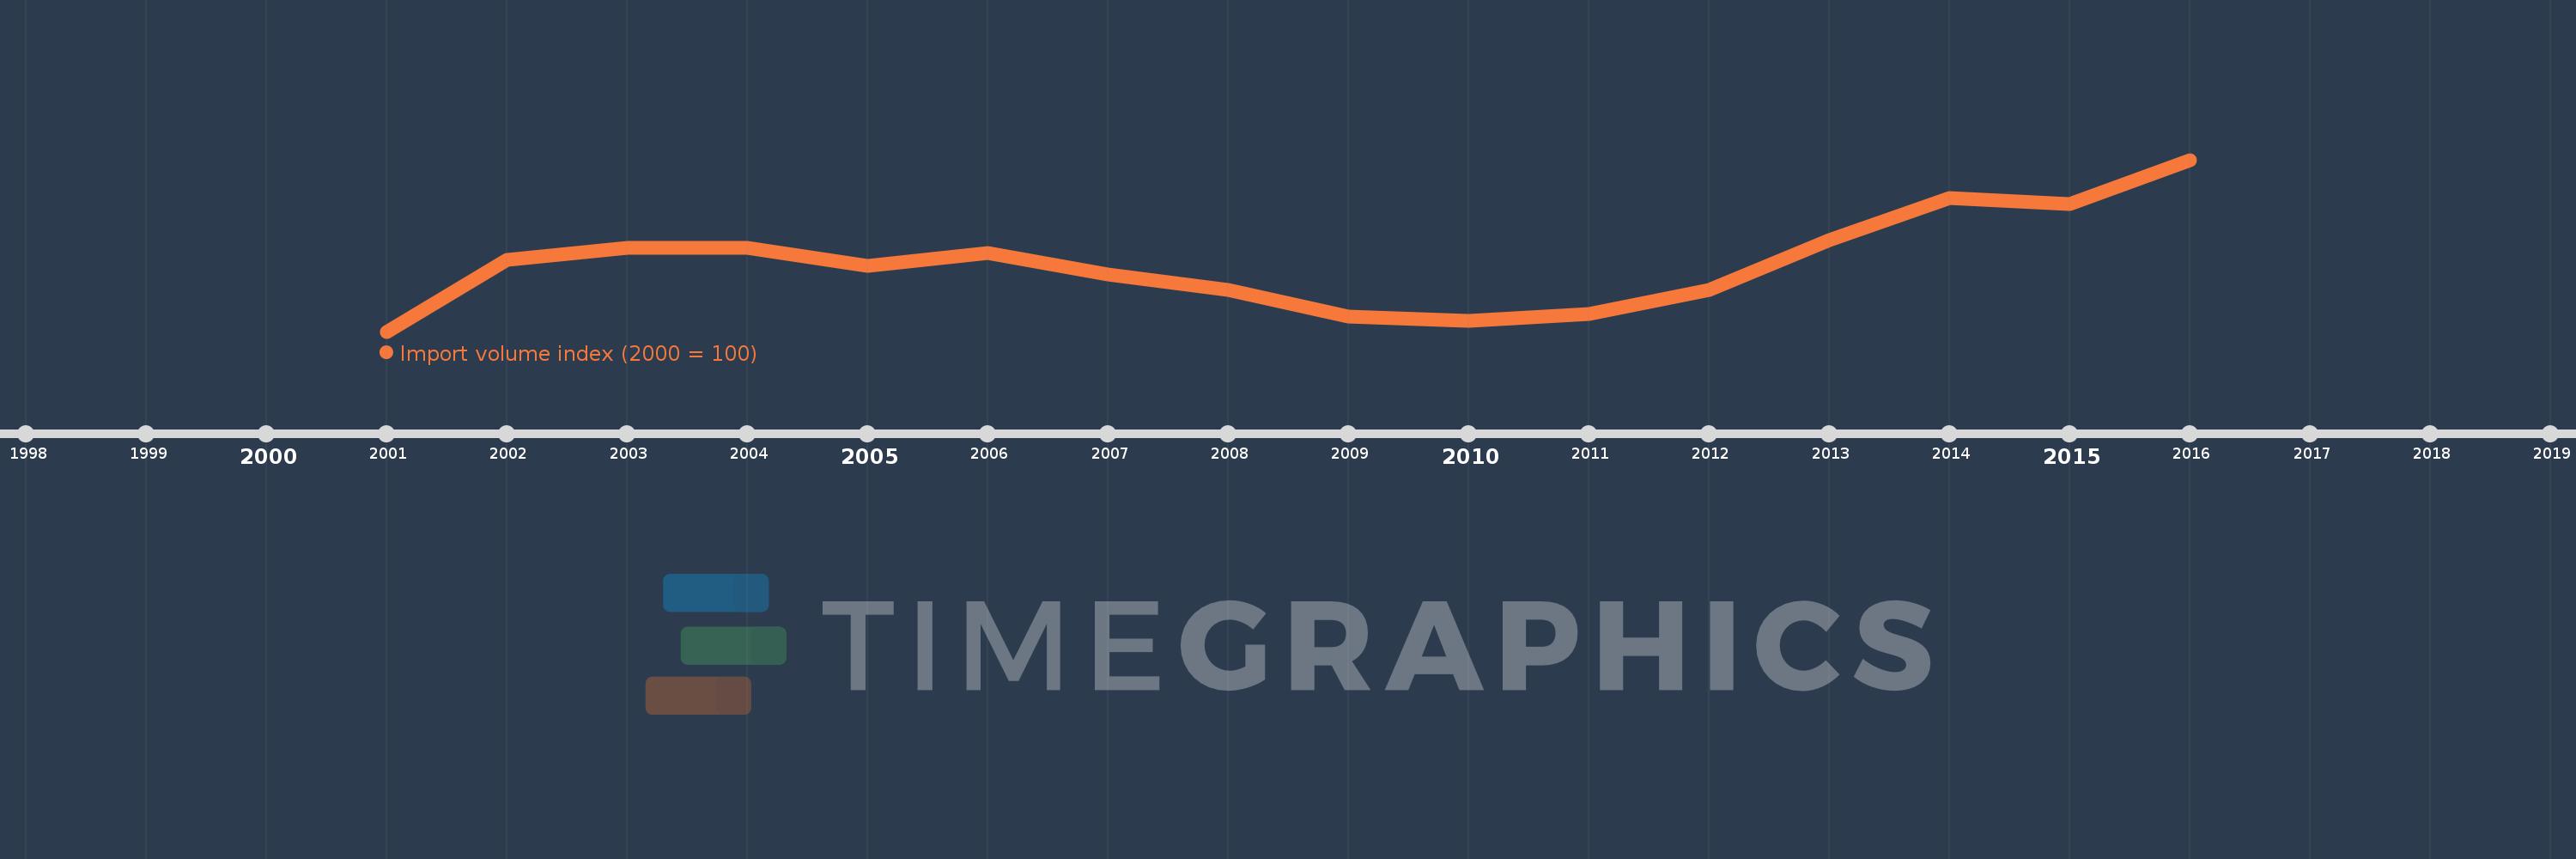
This timeline shows a graph from 2001 to 2016 of Korea, Dem. People’s Rep.. No data until 2000. Number of actual observations by date: 16.
Source name:
World Development Indicators
Source organization:
United Nations Conference on Trade and Development, Handbook of Statistics and data files, and International Monetary Fund, International Financial Statistics.
Categories, topics:
Private Sector, Trade
Last updated:
apr 23, 2017
Indicators value changes by year
Meaning:
117.691
Minimum:
100.0
jan 1, 2001
Maximum:
144.556
jan 1, 2016
At the date of observation
Value
Absolute change
Change from the previous value
jan 1, 2001
100.0
+100.0
0.0%
jan 1, 2002
118.607
+18.607
18.61%
jan 1, 2003
121.684
+3.077
2.59%
jan 1, 2004
121.641
-0.043
-0.04%
jan 1, 2005
116.99
-4.651
-3.82%
jan 1, 2006
120.481
+3.492
2.98%
jan 1, 2007
114.77
-5.711
-4.74%
jan 1, 2008
110.736
-4.034
-3.52%
jan 1, 2009
103.89
-6.846
-6.18%
jan 1, 2010
102.696
-1.194
-1.15%
jan 1, 2011
104.541
+1.846
1.8%
jan 1, 2012
110.854
+6.313
6.04%
jan 1, 2013
123.745
+12.891
11.63%
jan 1, 2014
134.723
+10.978
8.87%
jan 1, 2015
133.147
-1.576
-1.17%
jan 1, 2016
144.556
+11.409
8.57%
Ranking of countries by current statistics by years