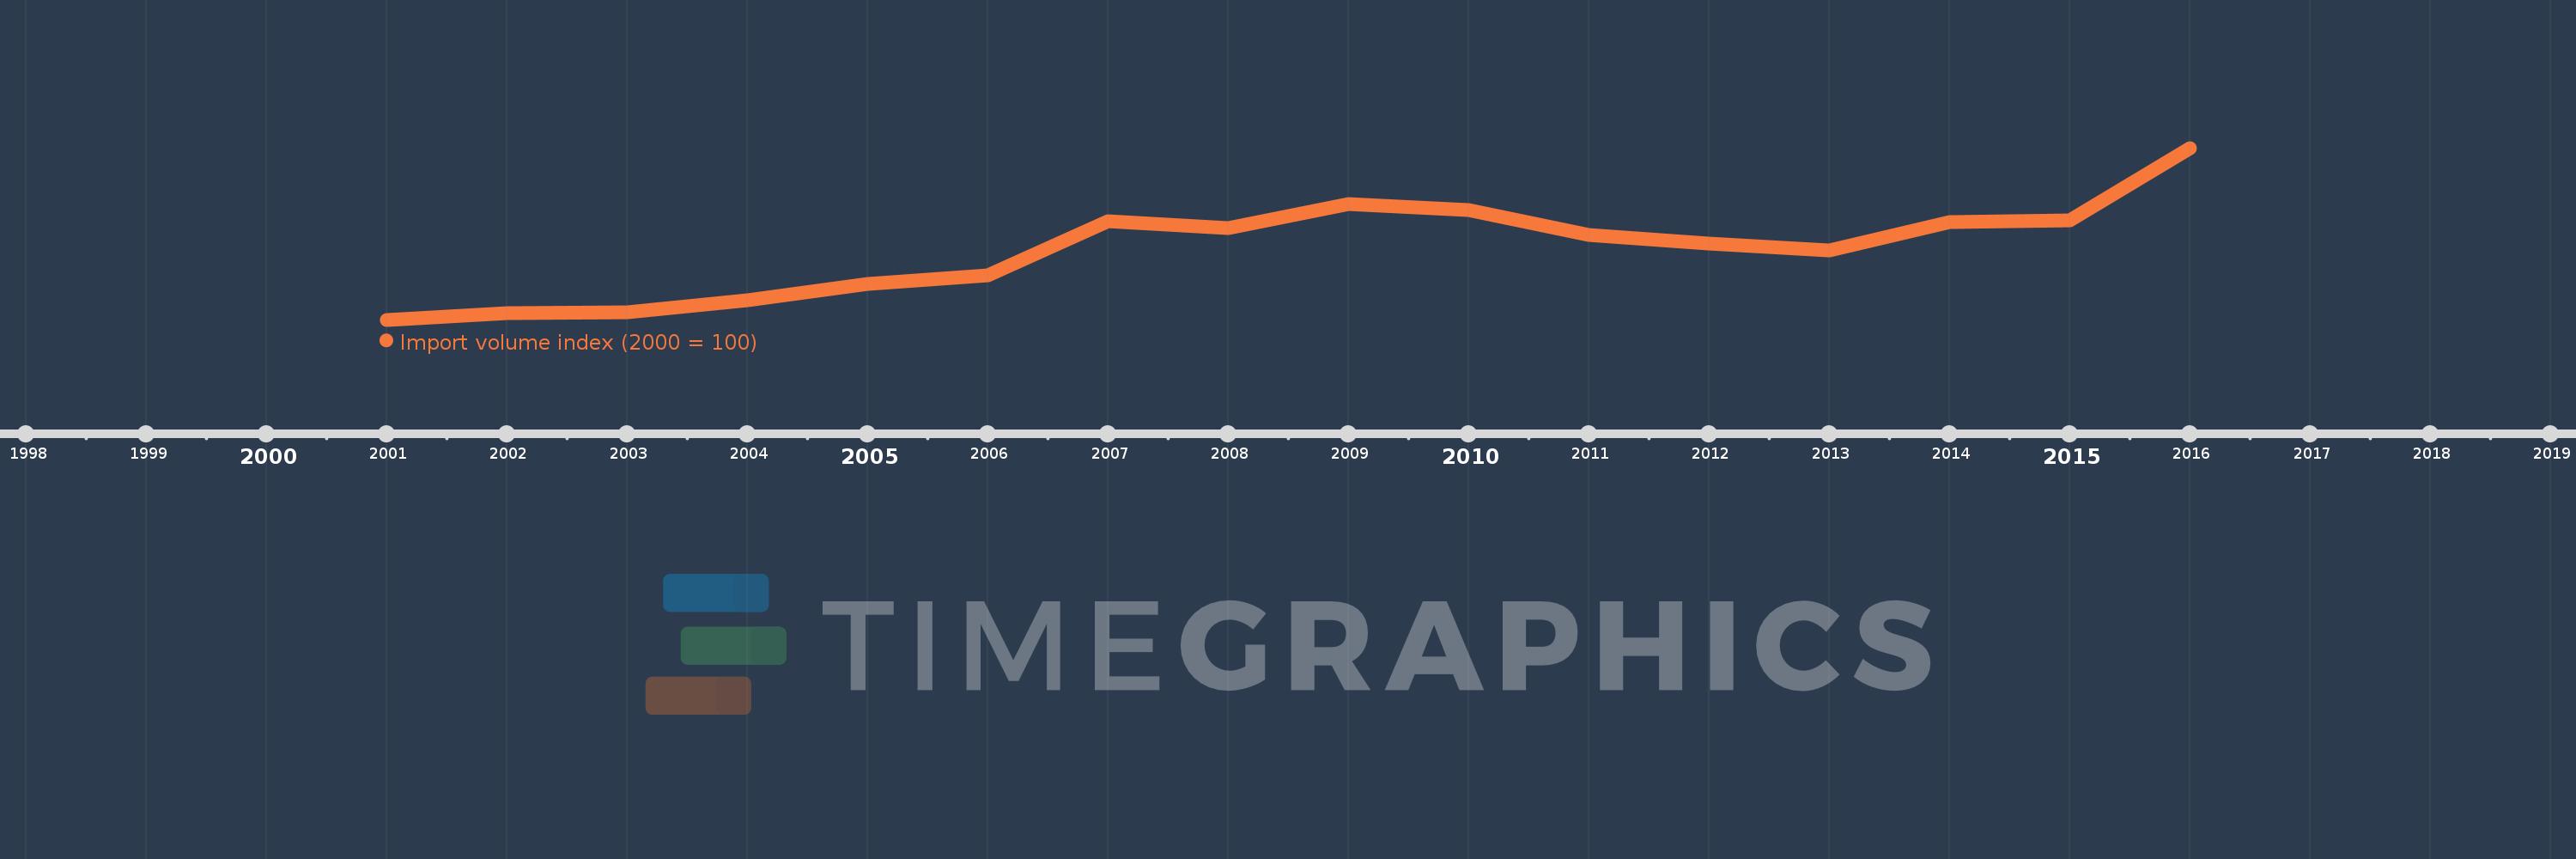
This timeline shows a graph from 2001 to 2016 of Vanuatu. No data until 2000. Number of actual observations by date: 16.
Source name:
World Development Indicators
Source organization:
United Nations Conference on Trade and Development, Handbook of Statistics and data files, and International Monetary Fund, International Financial Statistics.
Categories, topics:
Private Sector, Trade
Last updated:
apr 23, 2017
Indicators value changes by year
Meaning:
171.433
Minimum:
100.0
jan 1, 2001
Maximum:
273.917
jan 1, 2016
At the date of observation
Value
Absolute change
Change from the previous value
jan 1, 2001
100.0
+100.0
0.0%
jan 1, 2002
106.962
+6.962
6.96%
jan 1, 2003
107.394
+0.432
0.4%
jan 1, 2004
120.047
+12.653
11.78%
jan 1, 2005
136.221
+16.174
13.47%
jan 1, 2006
145.286
+9.066
6.66%
jan 1, 2007
199.584
+54.298
37.37%
jan 1, 2008
192.982
-6.602
-3.31%
jan 1, 2009
216.818
+23.837
12.35%
jan 1, 2010
211.374
-5.445
-2.51%
jan 1, 2011
185.687
-25.686
-12.15%
jan 1, 2012
177.411
-8.277
-4.46%
jan 1, 2013
170.179
-7.231
-4.08%
jan 1, 2014
198.859
+28.679
16.85%
jan 1, 2015
200.211
+1.352
0.68%
jan 1, 2016
273.917
+73.706
36.81%
Ranking of countries by current statistics by years