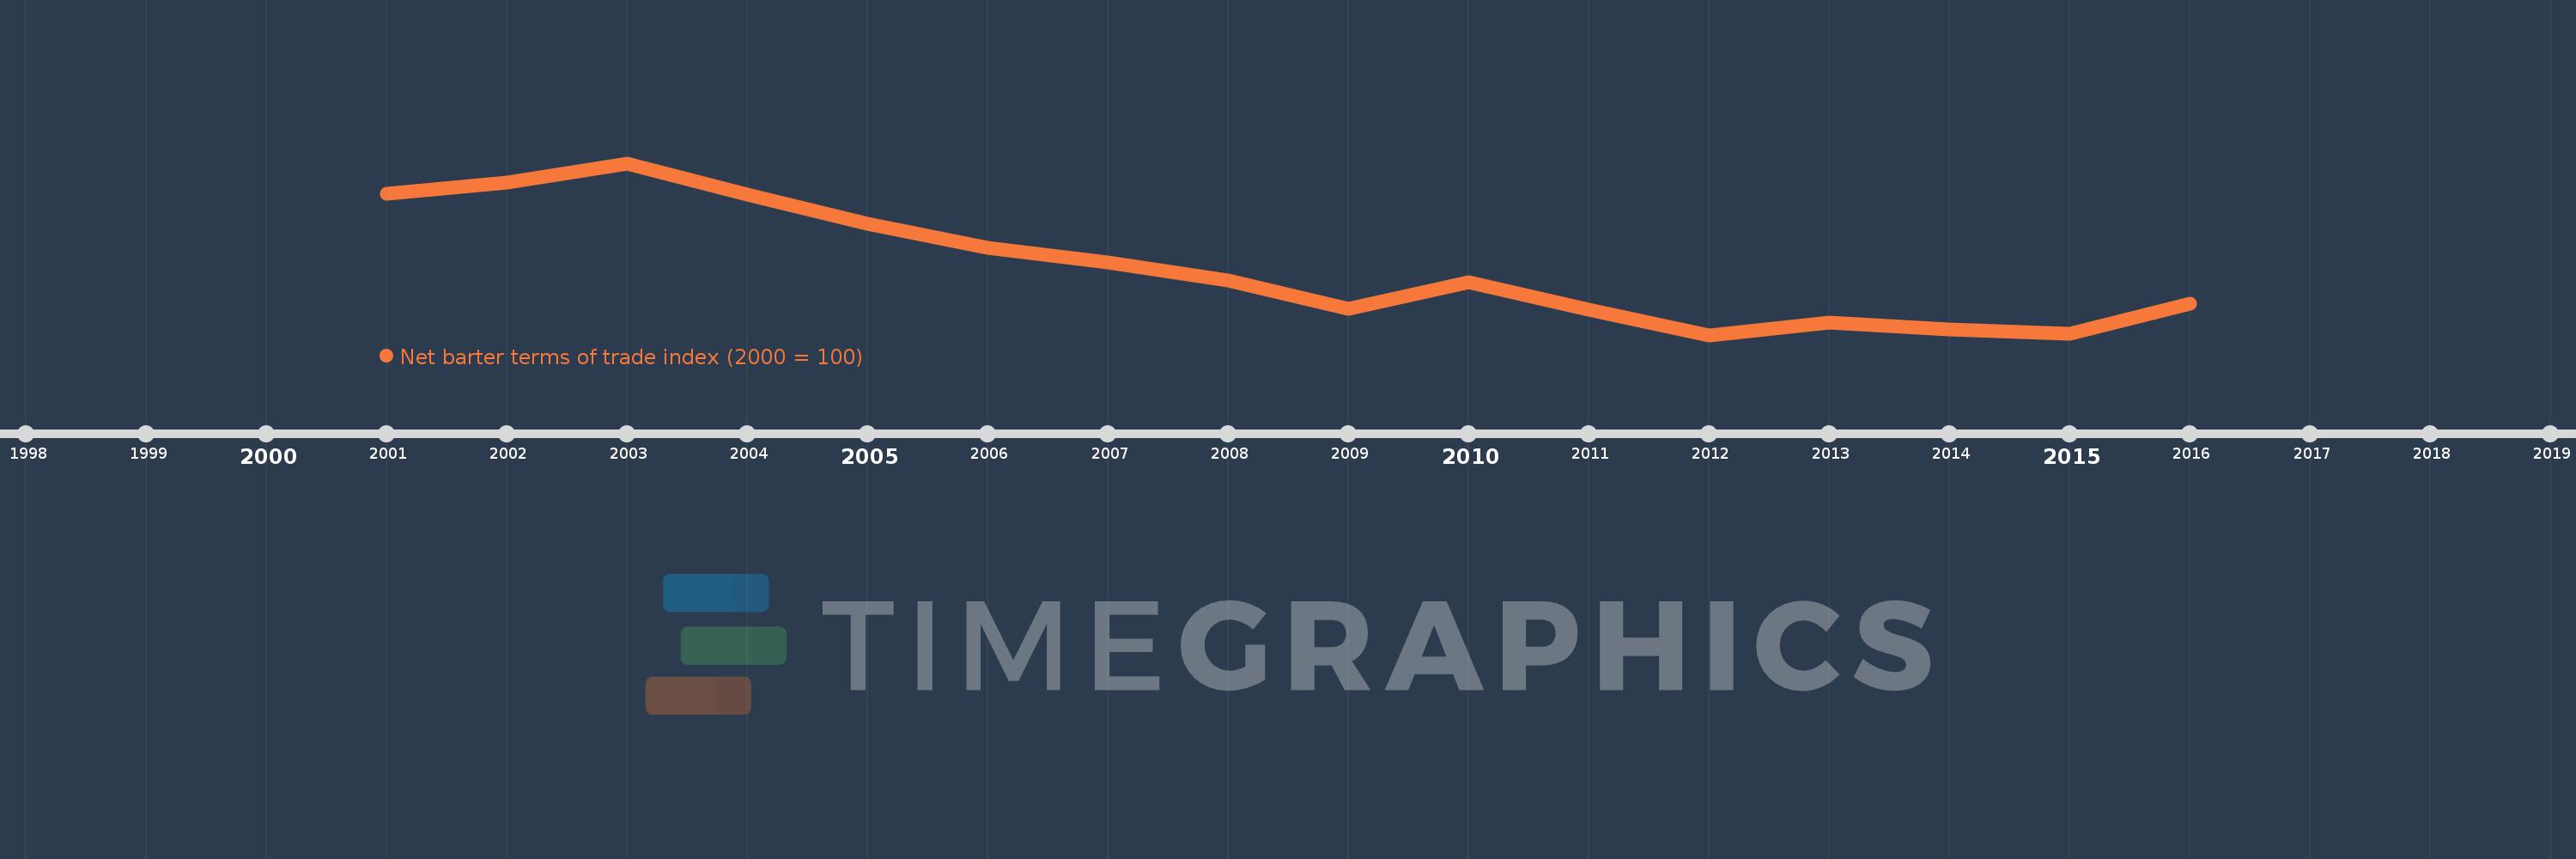
This timeline shows a graph from 2001 to 2016 of Cambodia. No data until 2000. Number of actual observations by date: 16.
Source name:
World Development Indicators
Source organization:
United Nations Conference on Trade and Development, Handbook of Statistics and data files, and International Monetary Fund, International Financial Statistics.
Categories, topics:
Private Sector, Trade
Last updated:
apr 23, 2017
Indicators value changes by year
Meaning:
83.697
Minimum:
68.602
jan 1, 2012
Maximum:
106.799
jan 1, 2003
At the date of observation
Value
Absolute change
Change from the previous value
jan 1, 2001
100.0
+100.0
0.0%
jan 1, 2002
102.435
+2.435
2.44%
jan 1, 2003
106.799
+4.363
4.26%
jan 1, 2004
99.828
-6.971
-6.53%
jan 1, 2005
93.417
-6.411
-6.42%
jan 1, 2006
87.944
-5.472
-5.86%
jan 1, 2007
84.668
-3.276
-3.73%
jan 1, 2008
80.753
-3.915
-4.62%
jan 1, 2009
74.38
-6.373
-7.89%
jan 1, 2010
80.378
+5.998
8.06%
jan 1, 2011
74.248
-6.13
-7.63%
jan 1, 2012
68.602
-5.646
-7.6%
jan 1, 2013
71.43
+2.828
4.12%
jan 1, 2014
69.873
-1.558
-2.18%
jan 1, 2015
68.854
-1.019
-1.46%
jan 1, 2016
75.542
+6.689
9.71%
Ranking of countries by current statistics by years