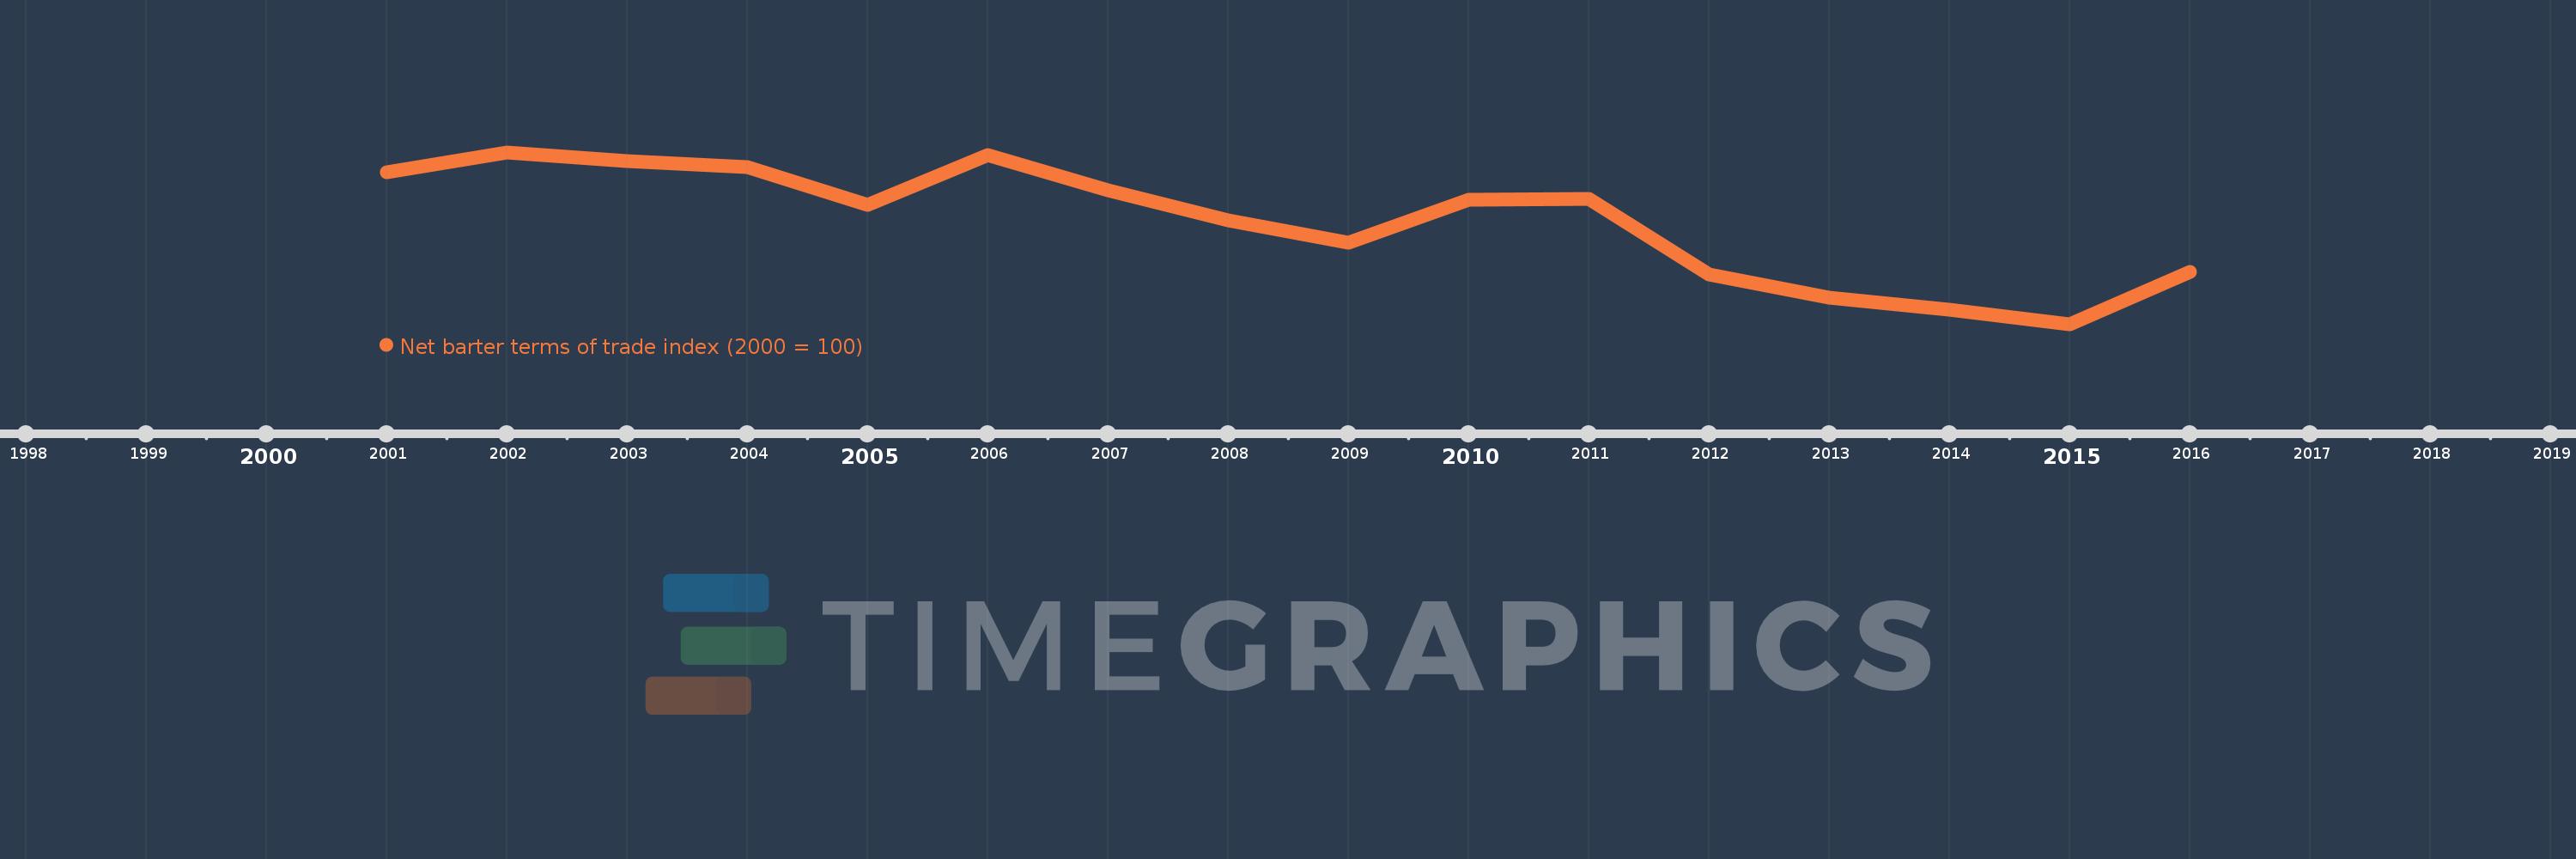
This timeline shows a graph from 2001 to 2016 of Ireland. No data until 2000. Number of actual observations by date: 16.
Source name:
World Development Indicators
Source organization:
United Nations Conference on Trade and Development, Handbook of Statistics and data files, and International Monetary Fund, International Financial Statistics.
Categories, topics:
Private Sector, Trade
Last updated:
apr 23, 2017
Indicators value changes by year
Meaning:
96.841
Minimum:
90.219
jan 1, 2015
Maximum:
101.292
jan 1, 2002
At the date of observation
Value
Absolute change
Change from the previous value
jan 1, 2001
100.0
+100.0
0.0%
jan 1, 2002
101.292
+1.292
1.29%
jan 1, 2003
100.749
-0.543
-0.54%
jan 1, 2004
100.334
-0.415
-0.41%
jan 1, 2005
97.896
-2.438
-2.43%
jan 1, 2006
101.128
+3.232
3.3%
jan 1, 2007
98.824
-2.304
-2.28%
jan 1, 2008
96.928
-1.896
-1.92%
jan 1, 2009
95.481
-1.447
-1.49%
jan 1, 2010
98.215
+2.734
2.86%
jan 1, 2011
98.318
+0.103
0.11%
jan 1, 2012
93.412
-4.907
-4.99%
jan 1, 2013
91.92
-1.492
-1.6%
jan 1, 2014
91.148
-0.772
-0.84%
jan 1, 2015
90.219
-0.929
-1.02%
jan 1, 2016
93.592
+3.374
3.74%
Ranking of countries by current statistics by years