This timeline shows a graph from 2009 to 2016 of Serbia. No data until 2008. Number of actual observations by date: 8.
Source name:
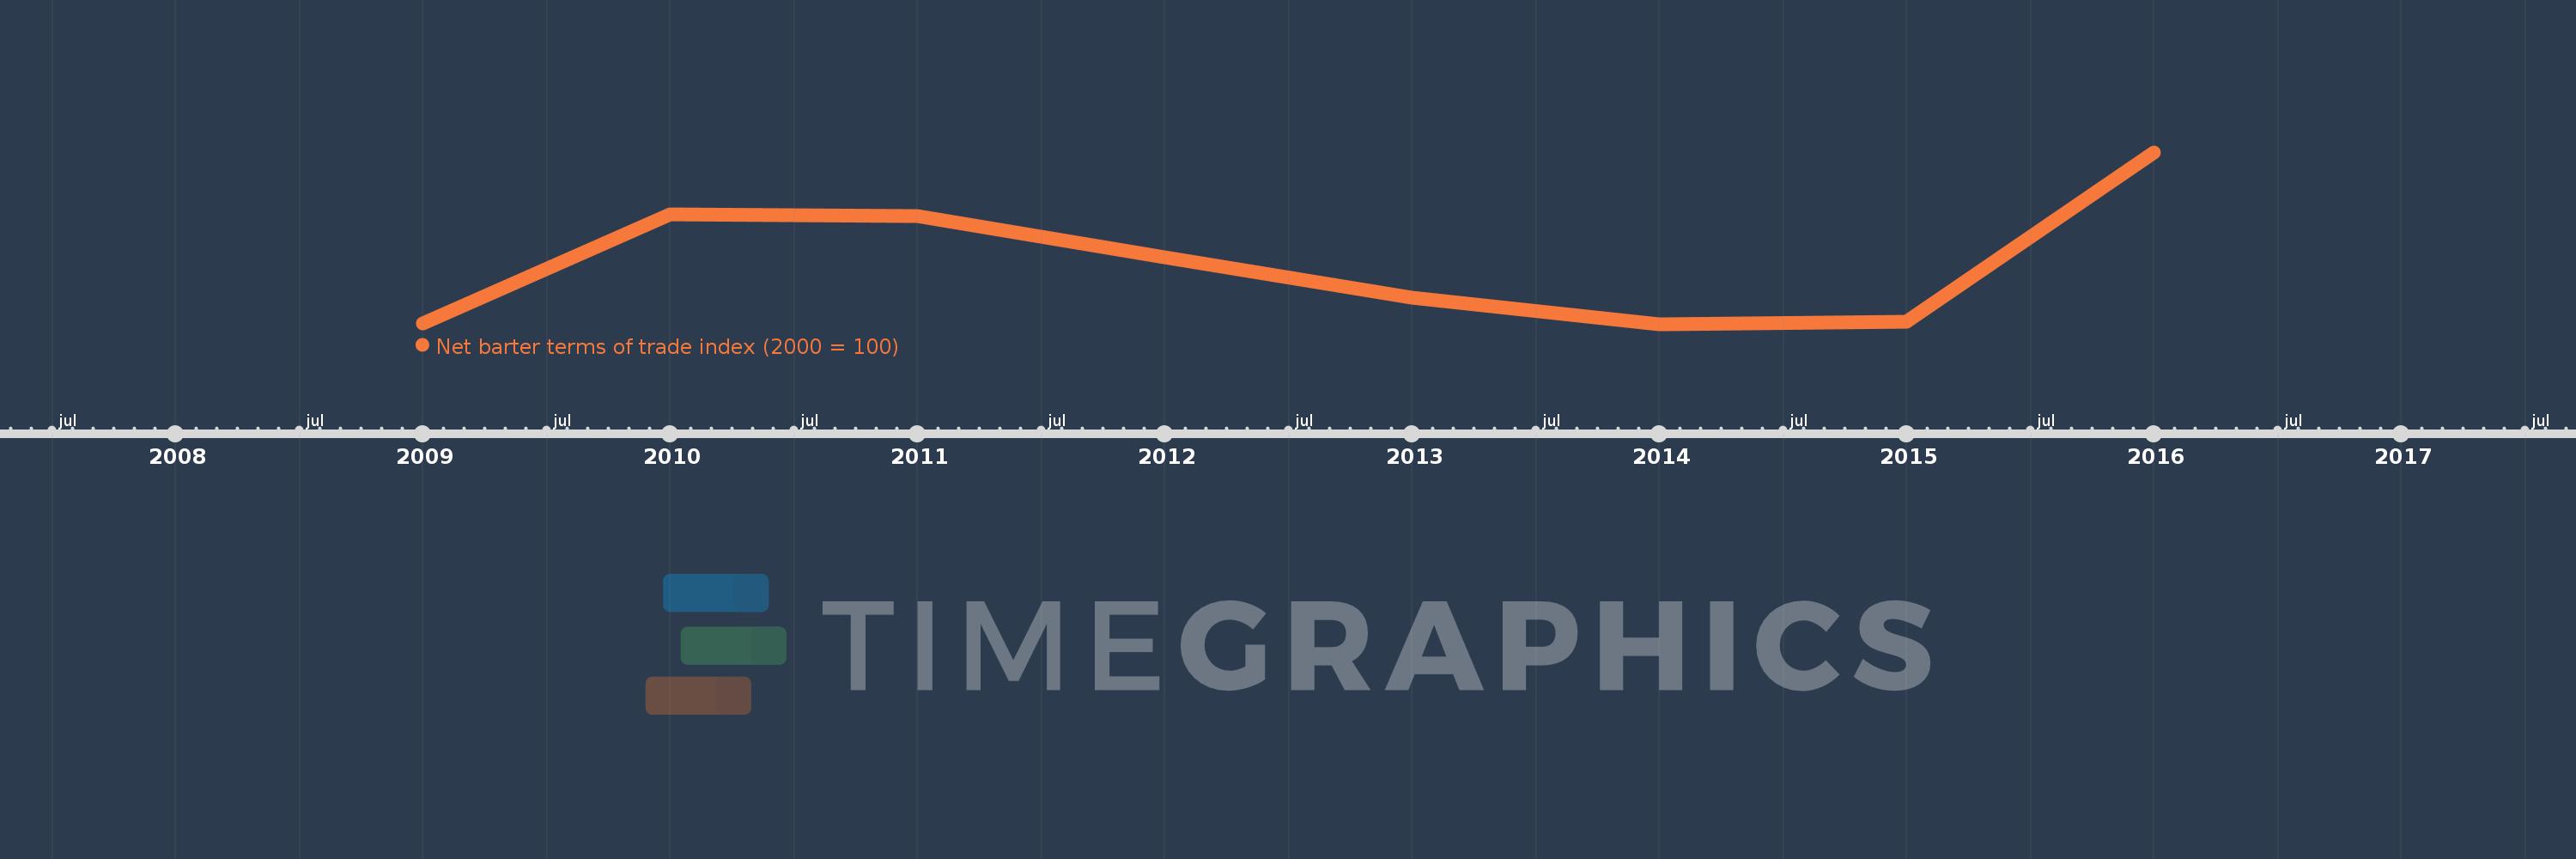
World Development Indicators
Source organization:
United Nations Conference on Trade and Development, Handbook of Statistics and data files, and International Monetary Fund, International Financial Statistics.
Categories, topics:
Private Sector, Trade
Last updated:
apr 23, 2017
Indicators value changes by year
Meaning:
104.186
Minimum:
102.693
jan 1, 2014
Maximum:
106.904
jan 1, 2016
At the date of observation
Value
Absolute change
Change from the previous value
jan 1, 2009
102.721
+102.721
0.0%
jan 1, 2010
105.389
+2.668
2.6%
jan 1, 2011
105.351
-0.038
-0.04%
jan 1, 2012
104.337
-1.014
-0.96%
jan 1, 2013
103.337
-1.0
-0.96%
jan 1, 2014
102.693
-0.644
-0.62%
jan 1, 2015
102.757
+0.064
0.06%
jan 1, 2016
106.904
+4.147
4.04%
Ranking of countries by current statistics by years