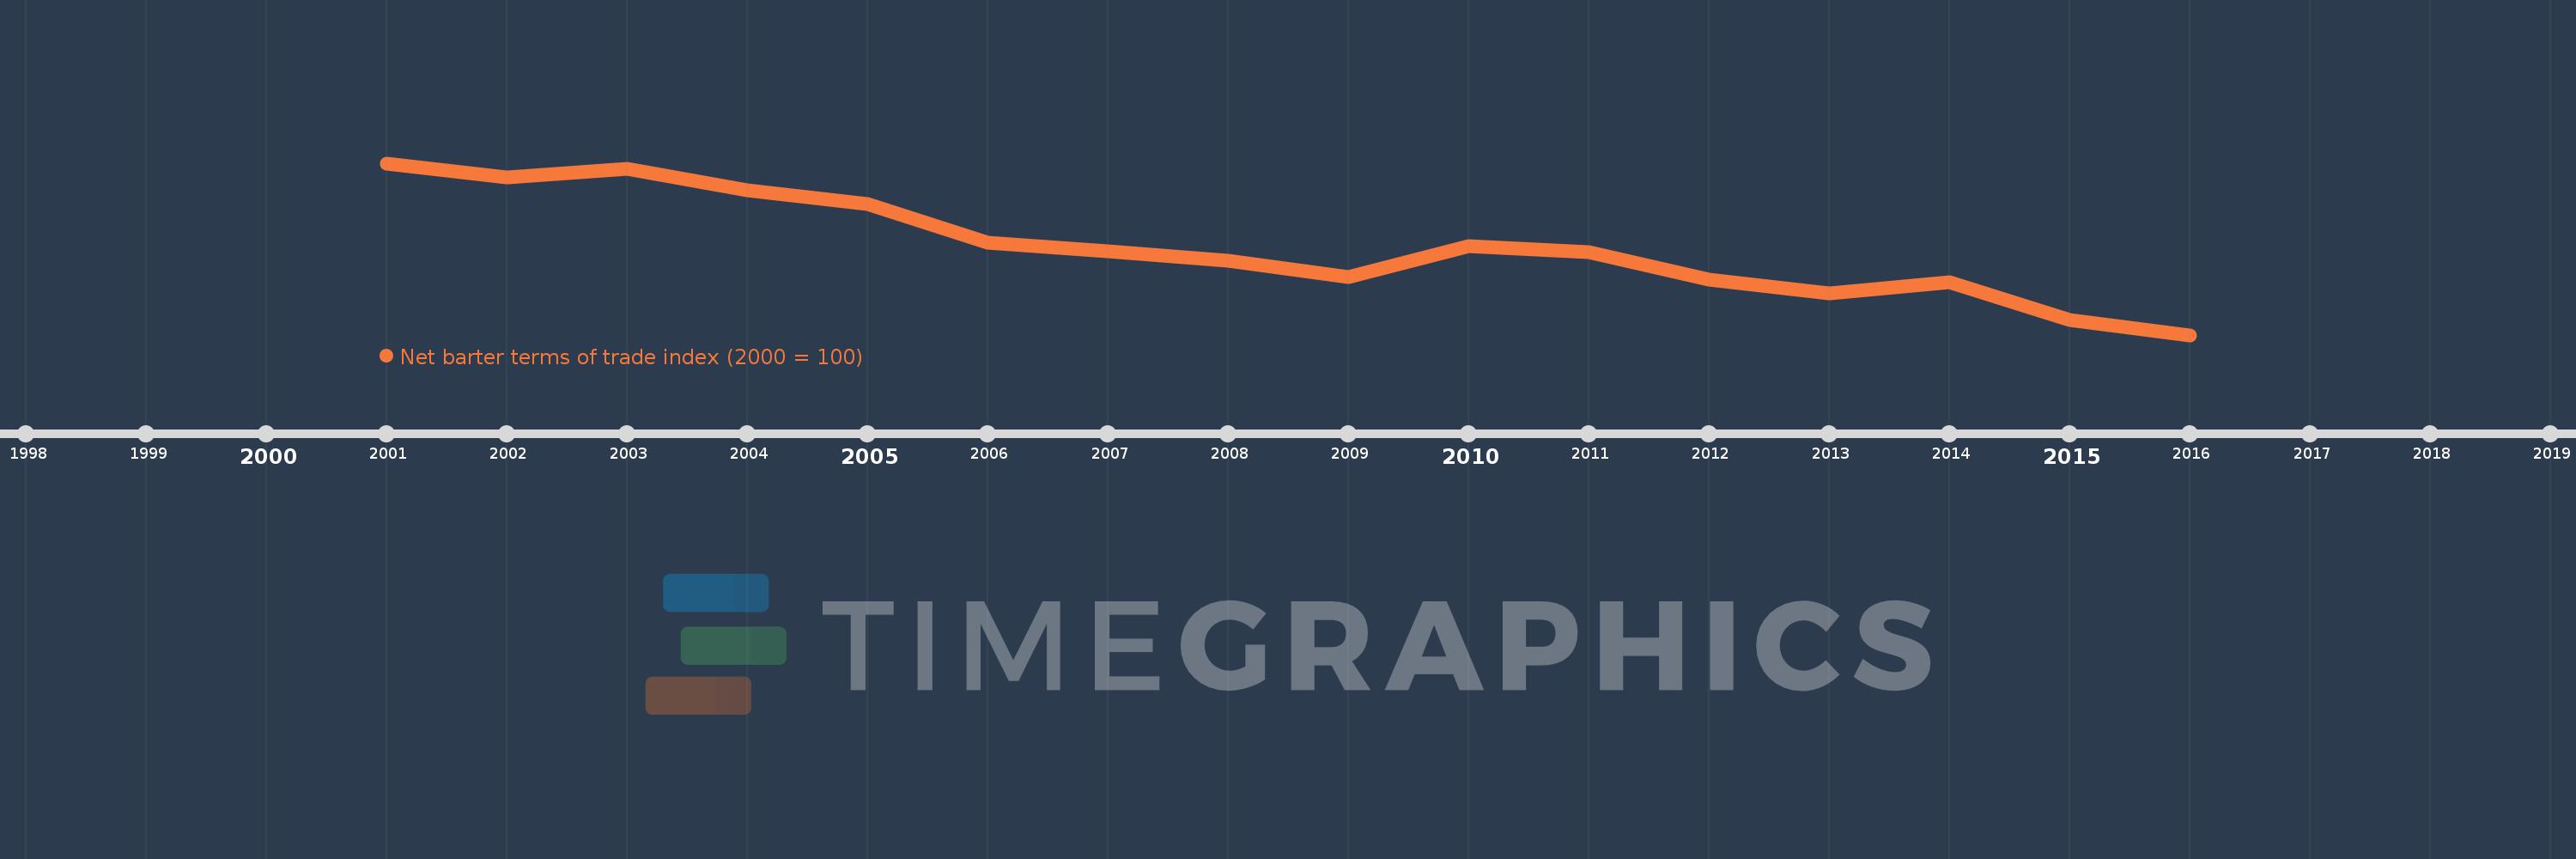
This timeline shows a graph from 2001 to 2016 of Sierra Leone. No data until 2000. Number of actual observations by date: 16.
Source name:
World Development Indicators
Source organization:
United Nations Conference on Trade and Development, Handbook of Statistics and data files, and International Monetary Fund, International Financial Statistics.
Categories, topics:
Private Sector, Trade
Last updated:
apr 23, 2017
Indicators value changes by year
Meaning:
72.916
Minimum:
44.093
jan 1, 2016
Maximum:
100.0
jan 1, 2001
At the date of observation
Value
Absolute change
Change from the previous value
jan 1, 2001
100.0
+100.0
0.0%
jan 1, 2002
95.391
-4.609
-4.61%
jan 1, 2003
98.314
+2.923
3.06%
jan 1, 2004
91.304
-7.01
-7.13%
jan 1, 2005
86.687
-4.617
-5.06%
jan 1, 2006
74.261
-12.426
-14.33%
jan 1, 2007
71.466
-2.795
-3.76%
jan 1, 2008
68.252
-3.214
-4.5%
jan 1, 2009
62.884
-5.367
-7.86%
jan 1, 2010
73.04
+10.156
16.15%
jan 1, 2011
71.112
-1.928
-2.64%
jan 1, 2012
62.205
-8.908
-12.53%
jan 1, 2013
57.549
-4.655
-7.48%
jan 1, 2014
61.179
+3.63
6.31%
jan 1, 2015
48.916
-12.263
-20.04%
jan 1, 2016
44.093
-4.823
-9.86%
Ranking of countries by current statistics by years