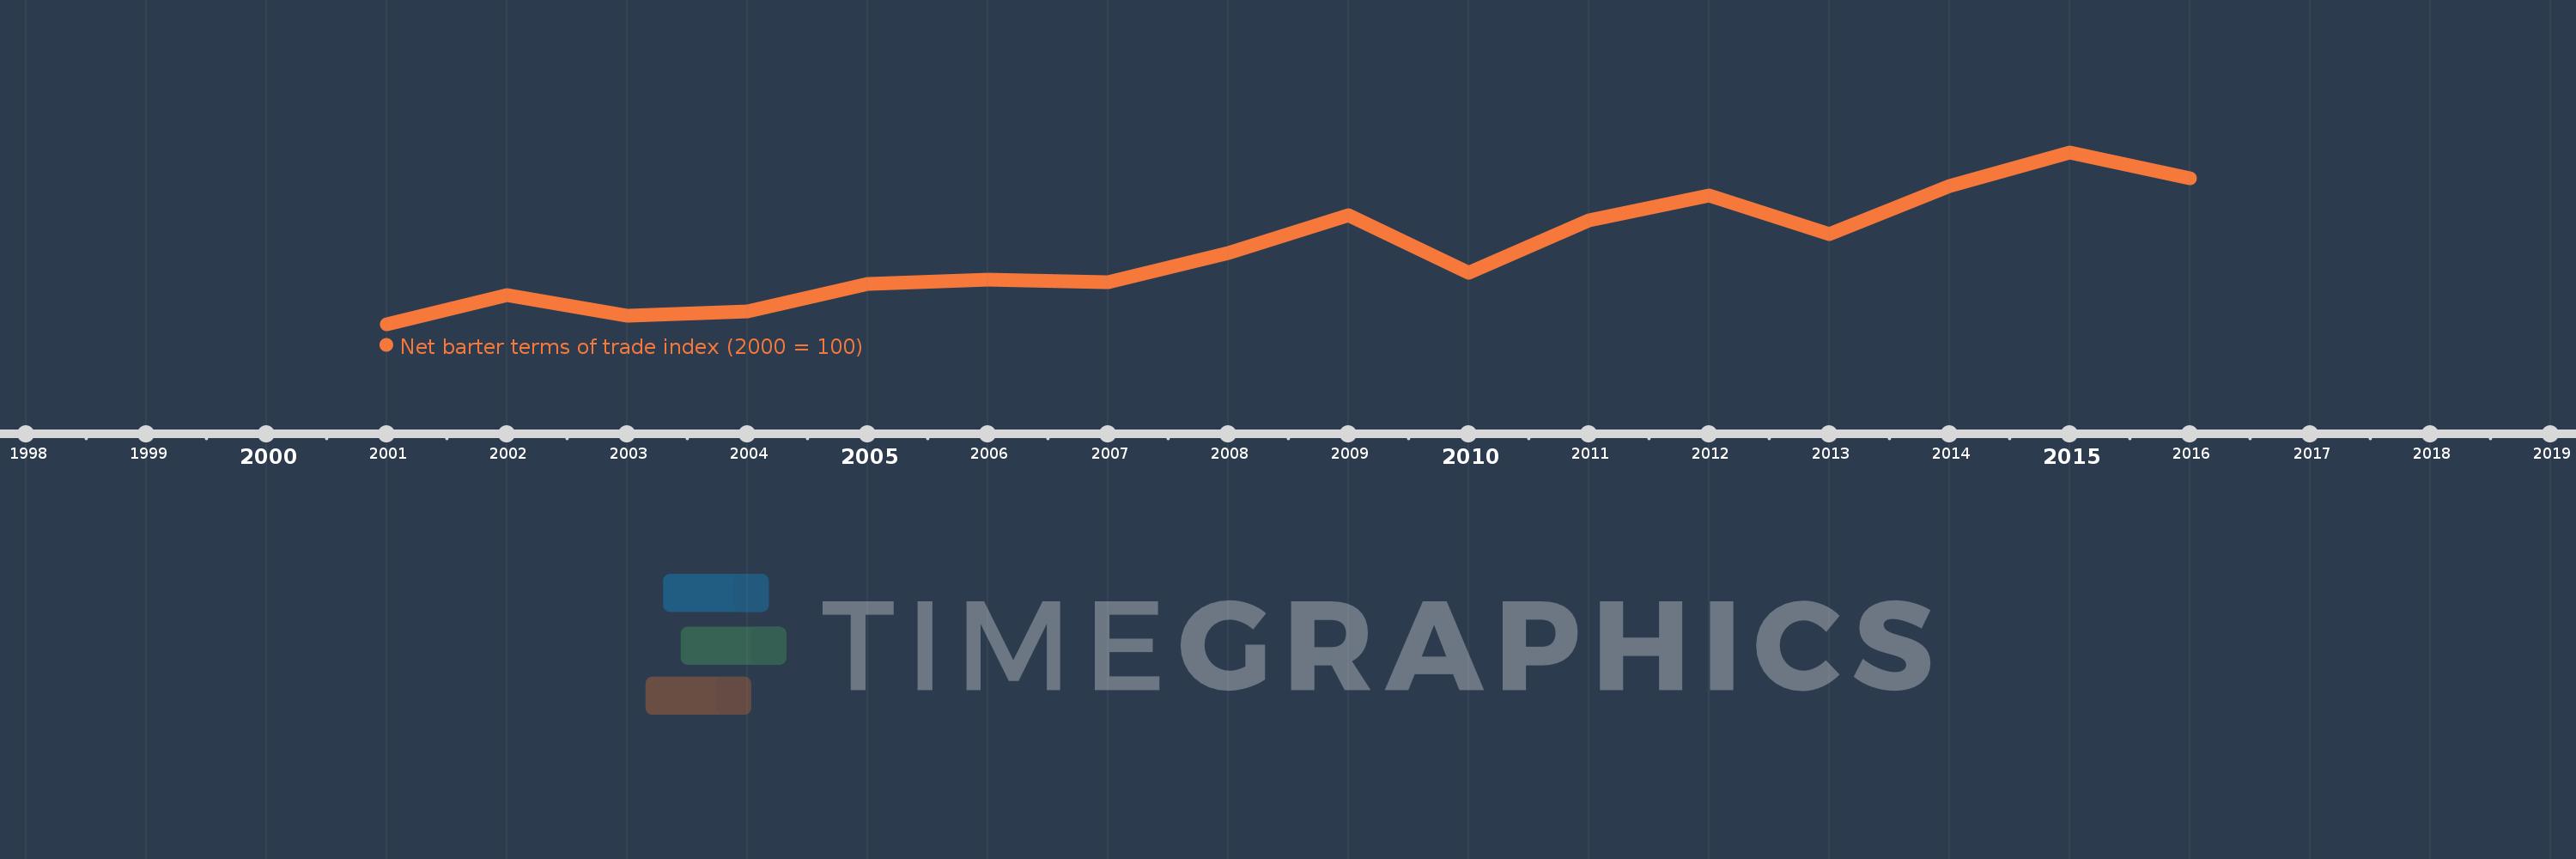
This timeline shows a graph from 2001 to 2016 of New Zealand. No data until 2000. Number of actual observations by date: 16.
Source name:
World Development Indicators
Source organization:
United Nations Conference on Trade and Development, Handbook of Statistics and data files, and International Monetary Fund, International Financial Statistics.
Categories, topics:
Private Sector, Trade
Last updated:
apr 23, 2017
Indicators value changes by year
Meaning:
116.717
Minimum:
100.0
jan 1, 2001
Maximum:
138.712
jan 1, 2015
At the date of observation
Value
Absolute change
Change from the previous value
jan 1, 2001
100.0
+100.0
0.0%
jan 1, 2002
106.489
+6.489
6.49%
jan 1, 2003
101.837
-4.652
-4.37%
jan 1, 2004
102.939
+1.102
1.08%
jan 1, 2005
109.083
+6.144
5.97%
jan 1, 2006
110.004
+0.921
0.84%
jan 1, 2007
109.463
-0.541
-0.49%
jan 1, 2008
115.995
+6.532
5.97%
jan 1, 2009
124.536
+8.54
7.36%
jan 1, 2010
111.563
-12.972
-10.42%
jan 1, 2011
123.477
+11.914
10.68%
jan 1, 2012
129.064
+5.588
4.53%
jan 1, 2013
120.366
-8.698
-6.74%
jan 1, 2014
131.127
+10.76
8.94%
jan 1, 2015
138.712
+7.586
5.79%
jan 1, 2016
132.813
-5.899
-4.25%
Ranking of countries by current statistics by years