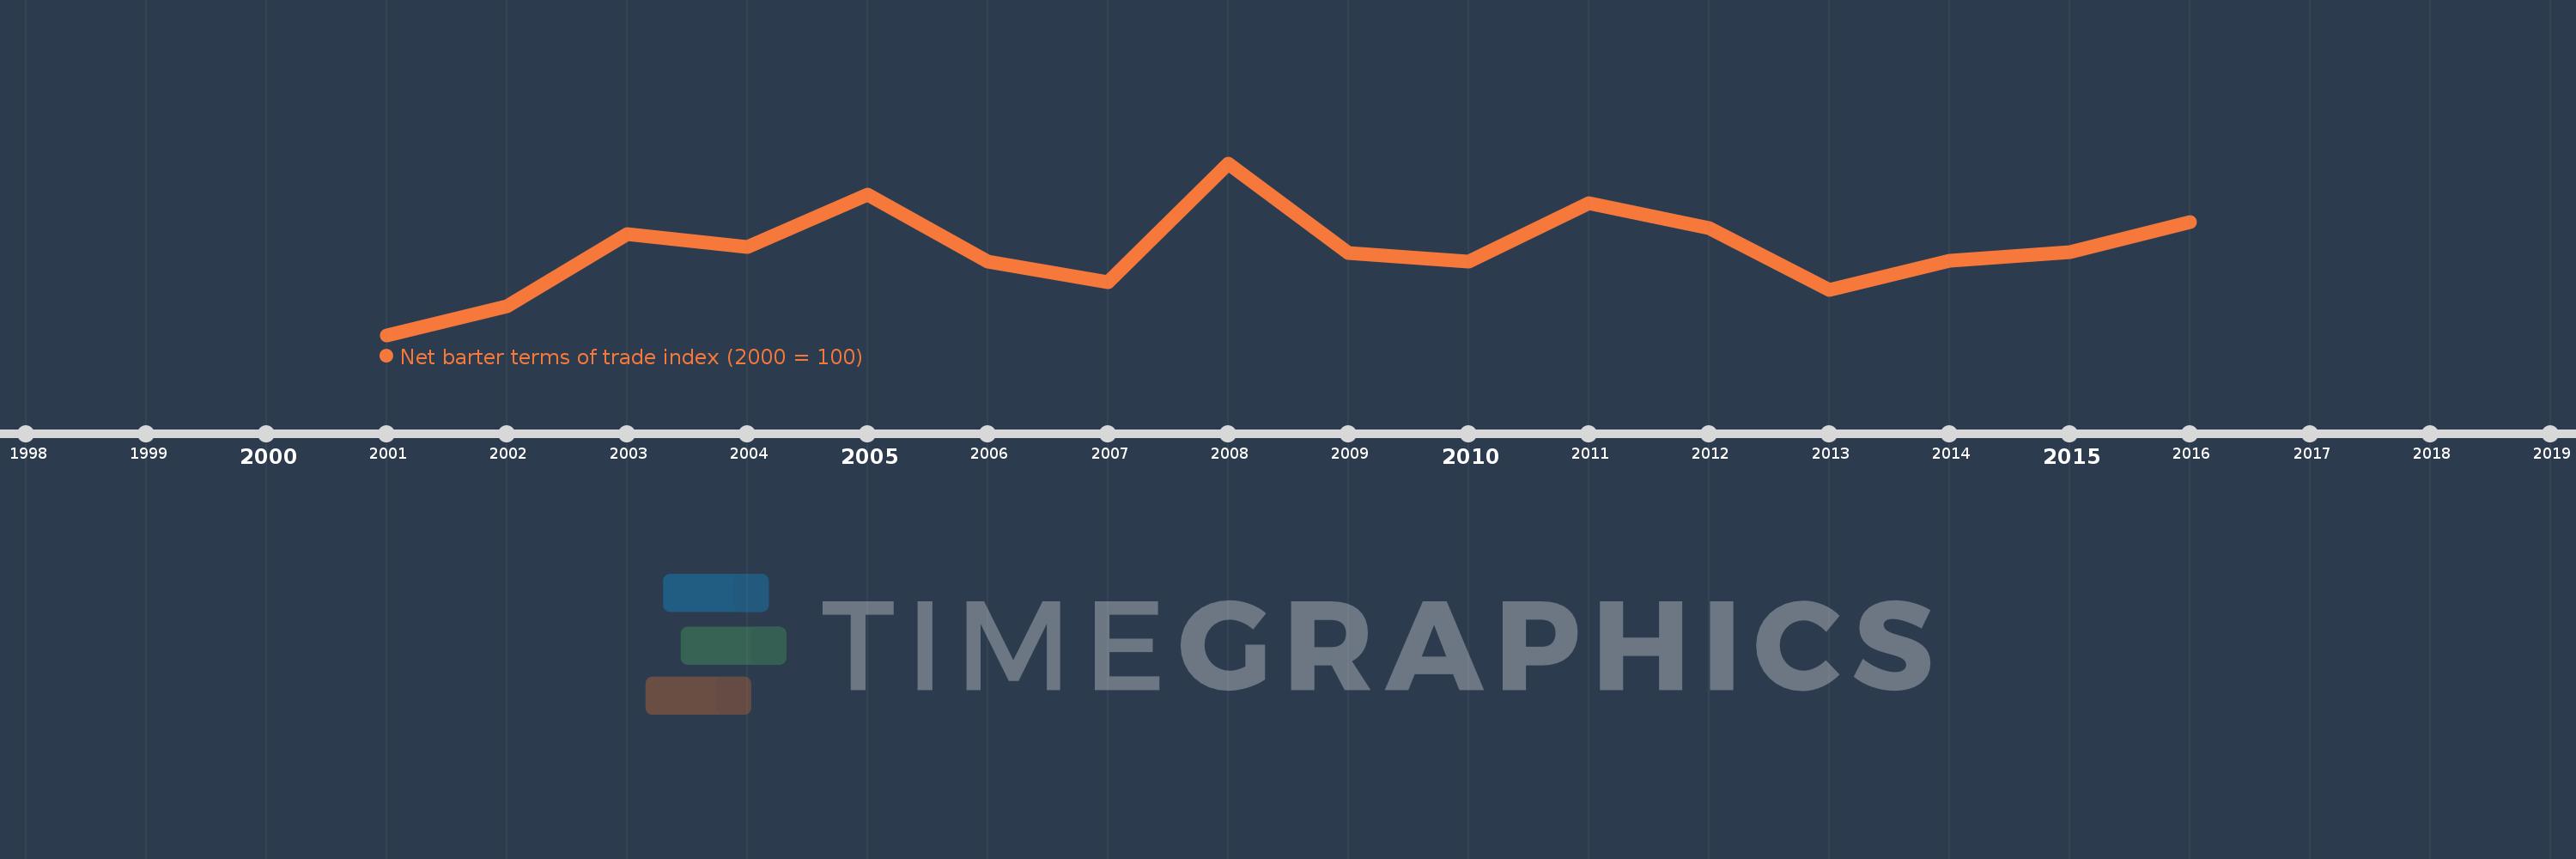
This timeline shows a graph from 2001 to 2016 of Latvia. No data until 2000. Number of actual observations by date: 16.
Source name:
World Development Indicators
Source organization:
United Nations Conference on Trade and Development, Handbook of Statistics and data files, and International Monetary Fund, International Financial Statistics.
Categories, topics:
Private Sector, Trade
Last updated:
apr 23, 2017
Indicators value changes by year
Meaning:
103.985
Minimum:
100.0
jan 1, 2001
Maximum:
108.028
jan 1, 2008
At the date of observation
Value
Absolute change
Change from the previous value
jan 1, 2001
100.0
+100.0
0.0%
jan 1, 2002
101.333
+1.333
1.33%
jan 1, 2003
104.707
+3.374
3.33%
jan 1, 2004
104.11
-0.596
-0.57%
jan 1, 2005
106.545
+2.435
2.34%
jan 1, 2006
103.443
-3.102
-2.91%
jan 1, 2007
102.452
-0.991
-0.96%
jan 1, 2008
108.028
+5.576
5.44%
jan 1, 2009
103.815
-4.212
-3.9%
jan 1, 2010
103.442
-0.374
-0.36%
jan 1, 2011
106.152
+2.71
2.62%
jan 1, 2012
104.984
-1.168
-1.1%
jan 1, 2013
102.118
-2.866
-2.73%
jan 1, 2014
103.47
+1.352
1.32%
jan 1, 2015
103.893
+0.423
0.41%
jan 1, 2016
105.274
+1.38
1.33%
Ranking of countries by current statistics by years