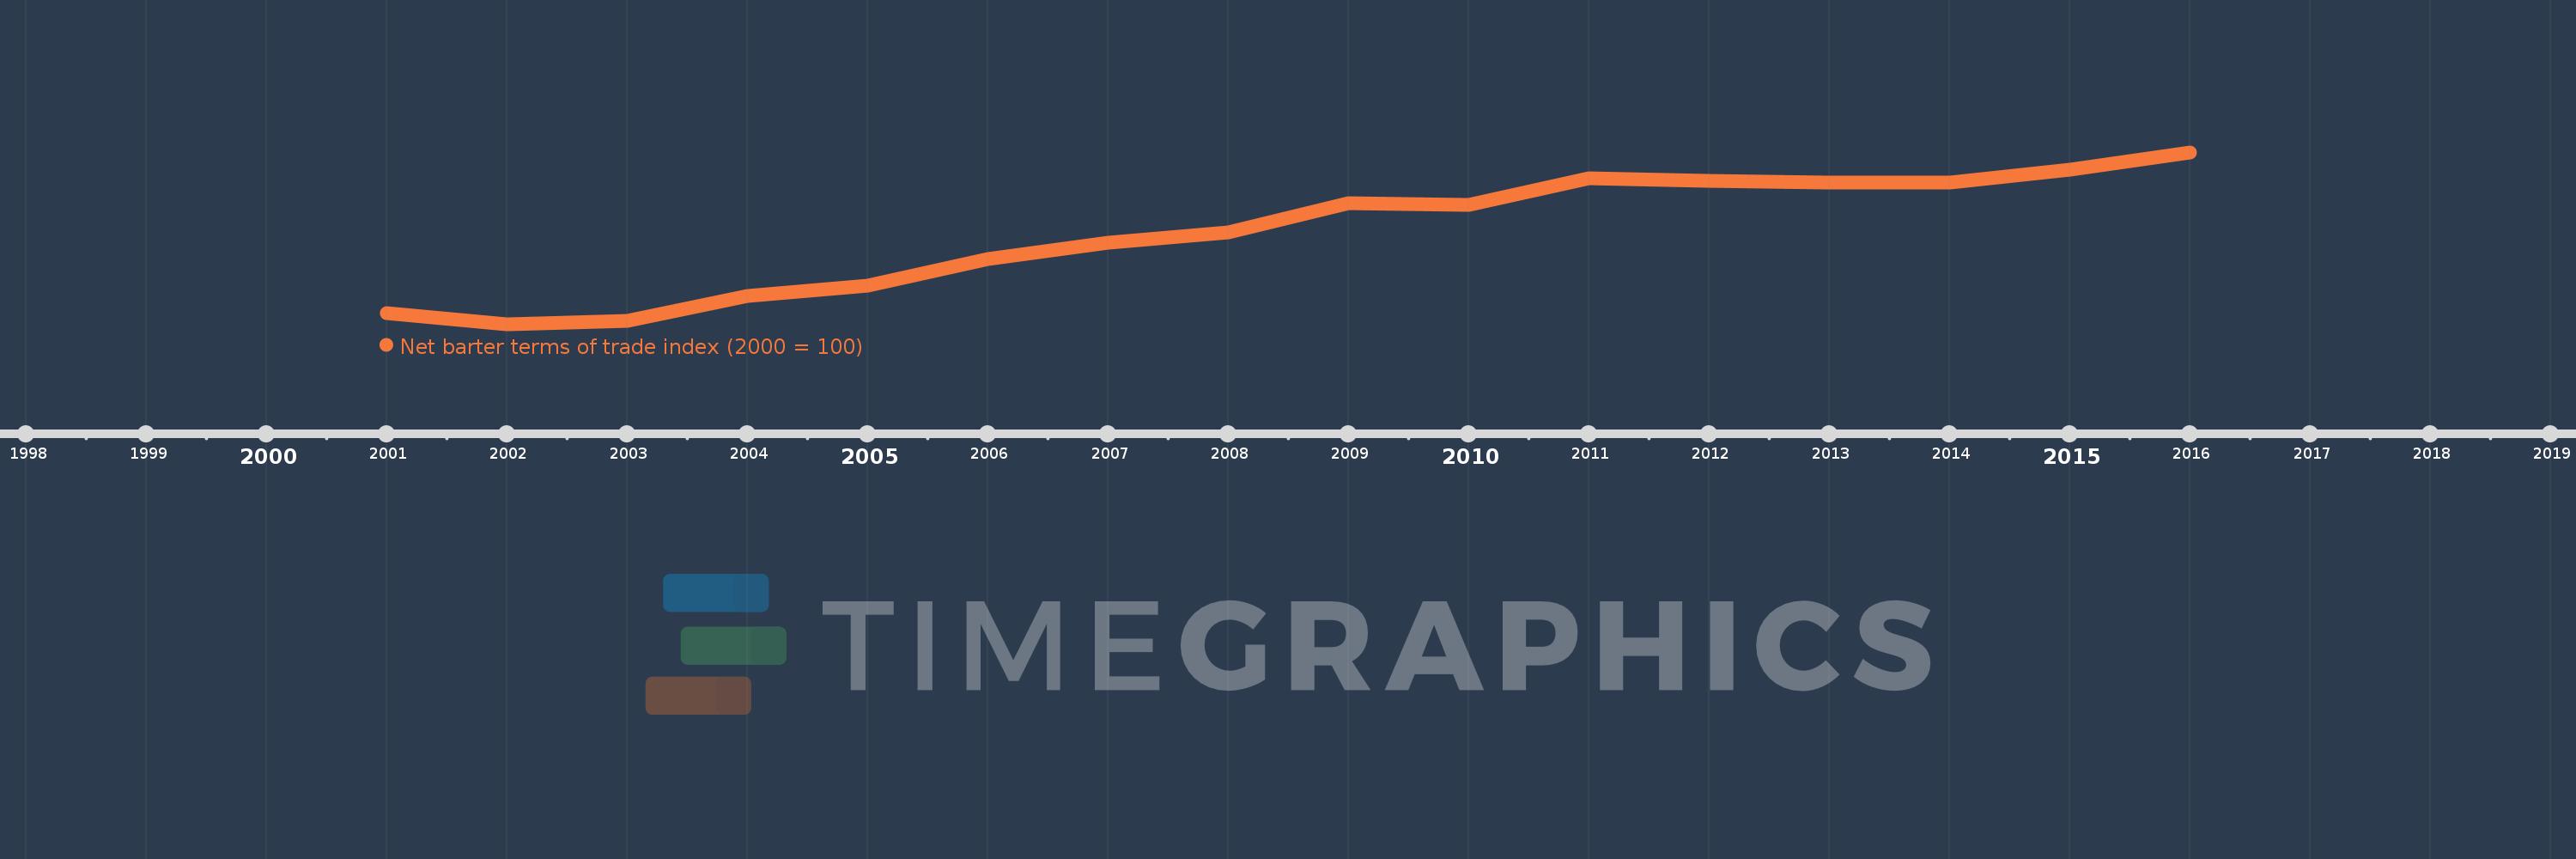
This timeline shows a graph from 2001 to 2016 of Vietnam. No data until 2000. Number of actual observations by date: 16.
Source name:
World Development Indicators
Source organization:
United Nations Conference on Trade and Development, Handbook of Statistics and data files, and International Monetary Fund, International Financial Statistics.
Categories, topics:
Private Sector, Trade
Last updated:
apr 23, 2017
Indicators value changes by year
Meaning:
118.095
Minimum:
97.503
jan 1, 2002
Maximum:
136.259
jan 1, 2016
At the date of observation
Value
Absolute change
Change from the previous value
jan 1, 2001
100.0
+100.0
0.0%
jan 1, 2002
97.503
-2.497
-2.5%
jan 1, 2003
98.283
+0.781
0.8%
jan 1, 2004
103.891
+5.608
5.71%
jan 1, 2005
106.166
+2.275
2.19%
jan 1, 2006
112.174
+6.008
5.66%
jan 1, 2007
115.956
+3.782
3.37%
jan 1, 2008
118.273
+2.317
2.0%
jan 1, 2009
124.877
+6.604
5.58%
jan 1, 2010
124.454
-0.424
-0.34%
jan 1, 2011
130.464
+6.011
4.83%
jan 1, 2012
129.813
-0.651
-0.5%
jan 1, 2013
129.552
-0.26
-0.2%
jan 1, 2014
129.552
0.0
0.0%
jan 1, 2015
132.301
+2.748
2.12%
jan 1, 2016
136.259
+3.958
2.99%
Ranking of countries by current statistics by years