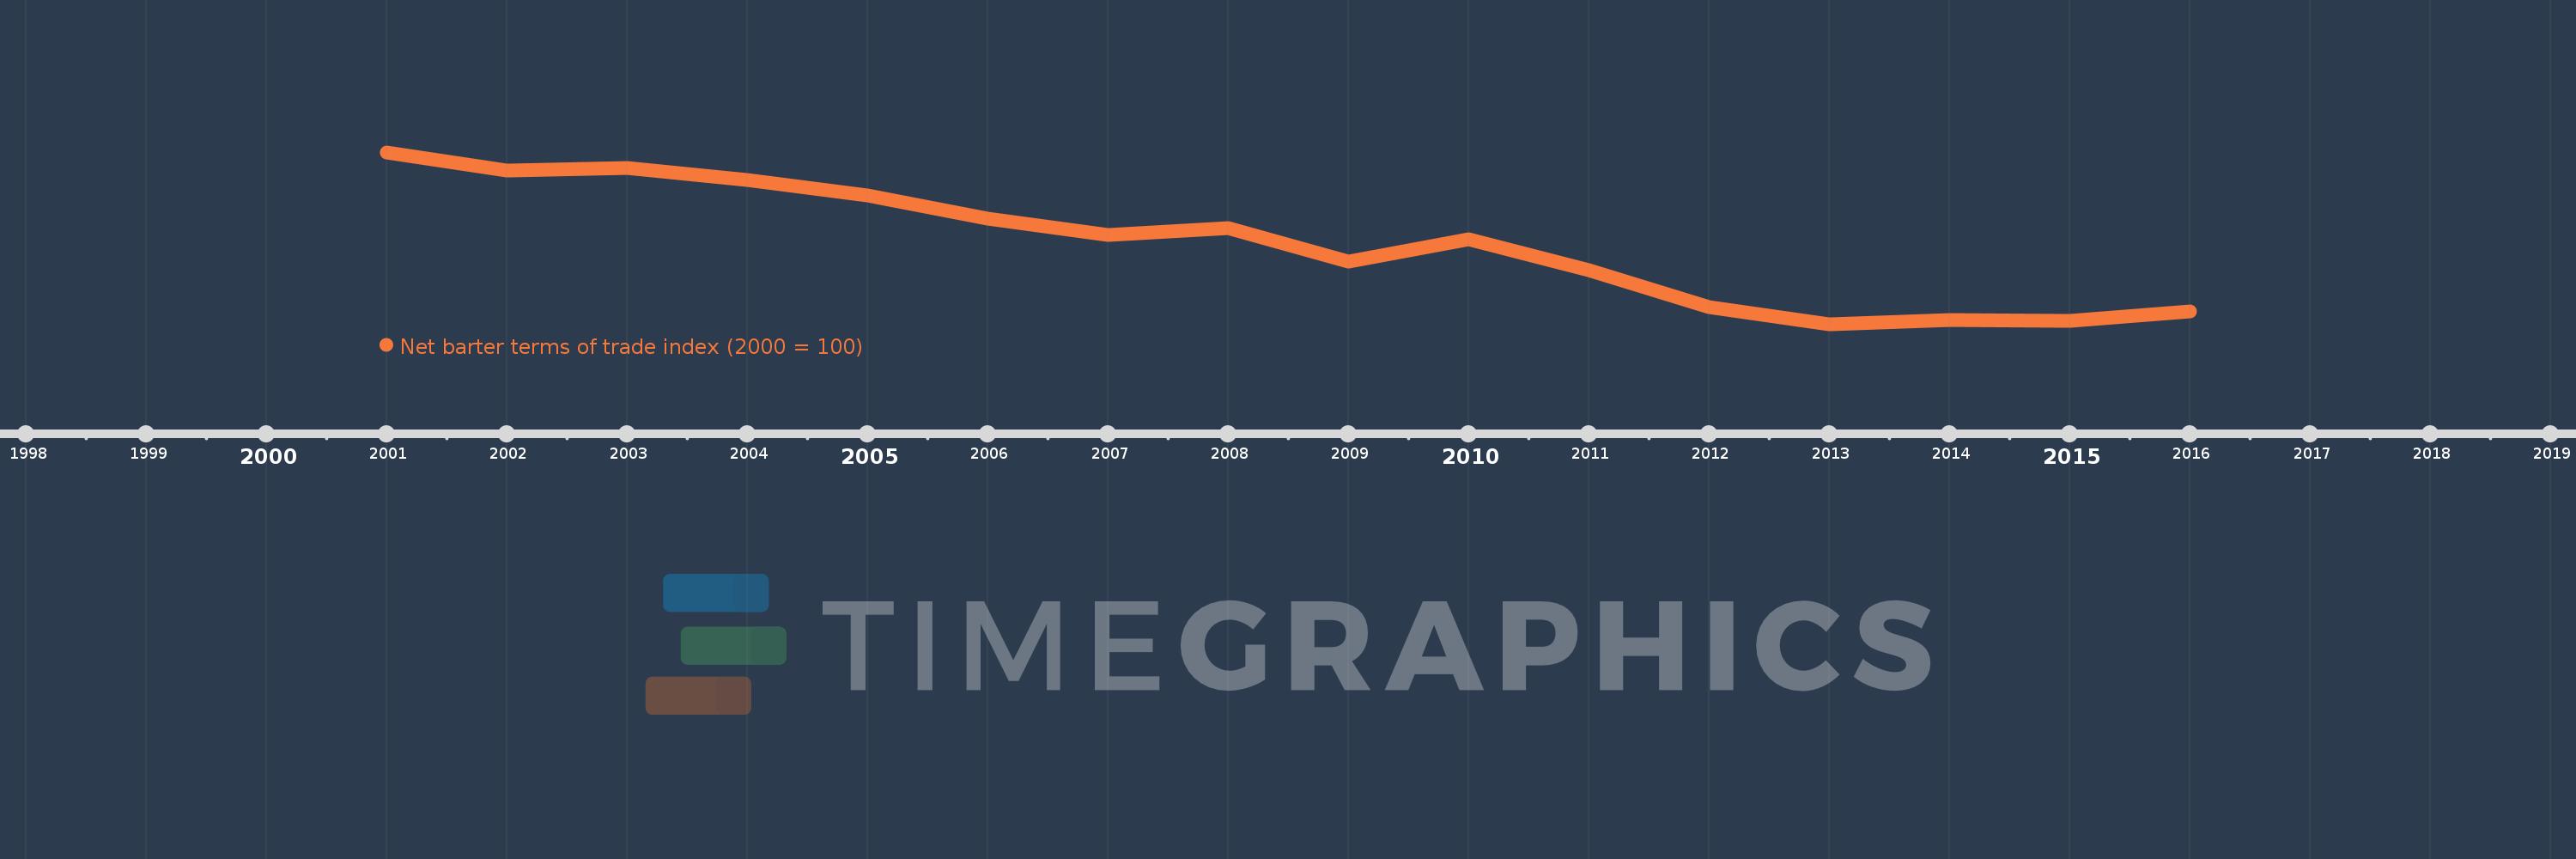
This timeline shows a graph from 2001 to 2016 of Austria. No data until 2000. Number of actual observations by date: 16.
Source name:
World Development Indicators
Source organization:
United Nations Conference on Trade and Development, Handbook of Statistics and data files, and International Monetary Fund, International Financial Statistics.
Categories, topics:
Private Sector, Trade
Last updated:
apr 23, 2017
Indicators value changes by year
Meaning:
93.305
Minimum:
87.433
jan 1, 2013
Maximum:
100.0
jan 1, 2001
At the date of observation
Value
Absolute change
Change from the previous value
jan 1, 2001
100.0
+100.0
0.0%
jan 1, 2002
98.683
-1.317
-1.32%
jan 1, 2003
98.858
+0.174
0.18%
jan 1, 2004
97.996
-0.861
-0.87%
jan 1, 2005
96.858
-1.138
-1.16%
jan 1, 2006
95.129
-1.73
-1.79%
jan 1, 2007
93.959
-1.17
-1.23%
jan 1, 2008
94.471
+0.512
0.55%
jan 1, 2009
92.014
-2.457
-2.6%
jan 1, 2010
93.667
+1.654
1.8%
jan 1, 2011
91.373
-2.294
-2.45%
jan 1, 2012
88.664
-2.71
-2.97%
jan 1, 2013
87.433
-1.231
-1.39%
jan 1, 2014
87.751
+0.319
0.36%
jan 1, 2015
87.662
-0.089
-0.1%
jan 1, 2016
88.358
+0.695
0.79%
Ranking of countries by current statistics by years