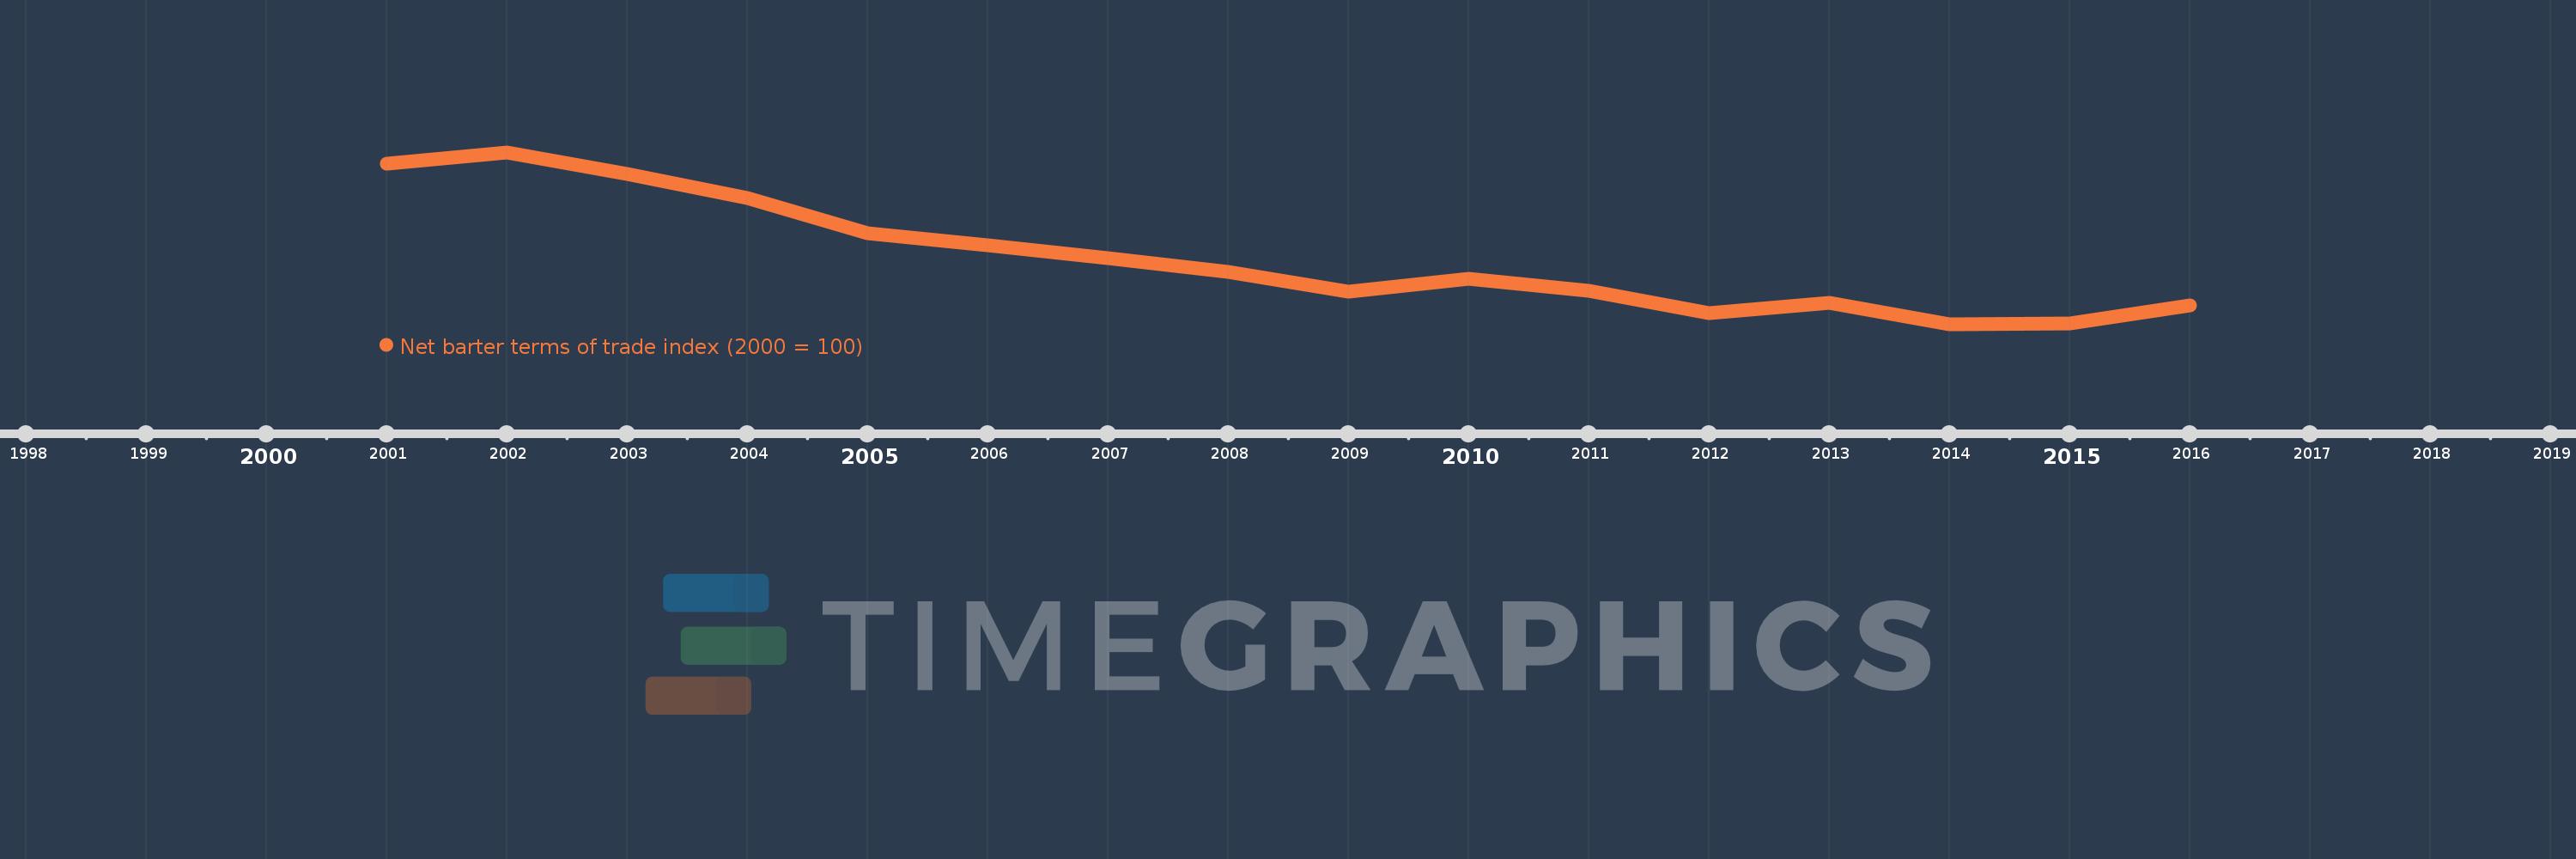
This timeline shows a graph from 2001 to 2016 of St. Kitts and Nevis. No data until 2000. Number of actual observations by date: 16.
Source name:
World Development Indicators
Source organization:
United Nations Conference on Trade and Development, Handbook of Statistics and data files, and International Monetary Fund, International Financial Statistics.
Categories, topics:
Private Sector, Trade
Last updated:
apr 23, 2017
Indicators value changes by year
Meaning:
81.475
Minimum:
68.508
jan 1, 2014
Maximum:
102.129
jan 1, 2002
At the date of observation
Value
Absolute change
Change from the previous value
jan 1, 2001
100.0
+100.0
0.0%
jan 1, 2002
102.129
+2.129
2.13%
jan 1, 2003
97.863
-4.266
-4.18%
jan 1, 2004
93.13
-4.733
-4.84%
jan 1, 2005
86.356
-6.774
-7.27%
jan 1, 2006
83.873
-2.483
-2.88%
jan 1, 2007
81.498
-2.375
-2.83%
jan 1, 2008
78.729
-2.769
-3.4%
jan 1, 2009
74.805
-3.924
-4.98%
jan 1, 2010
77.445
+2.64
3.53%
jan 1, 2011
75.036
-2.409
-3.11%
jan 1, 2012
70.754
-4.282
-5.71%
jan 1, 2013
72.722
+1.967
2.78%
jan 1, 2014
68.508
-4.213
-5.79%
jan 1, 2015
68.585
+0.077
0.11%
jan 1, 2016
72.159
+3.575
5.21%
Ranking of countries by current statistics by years