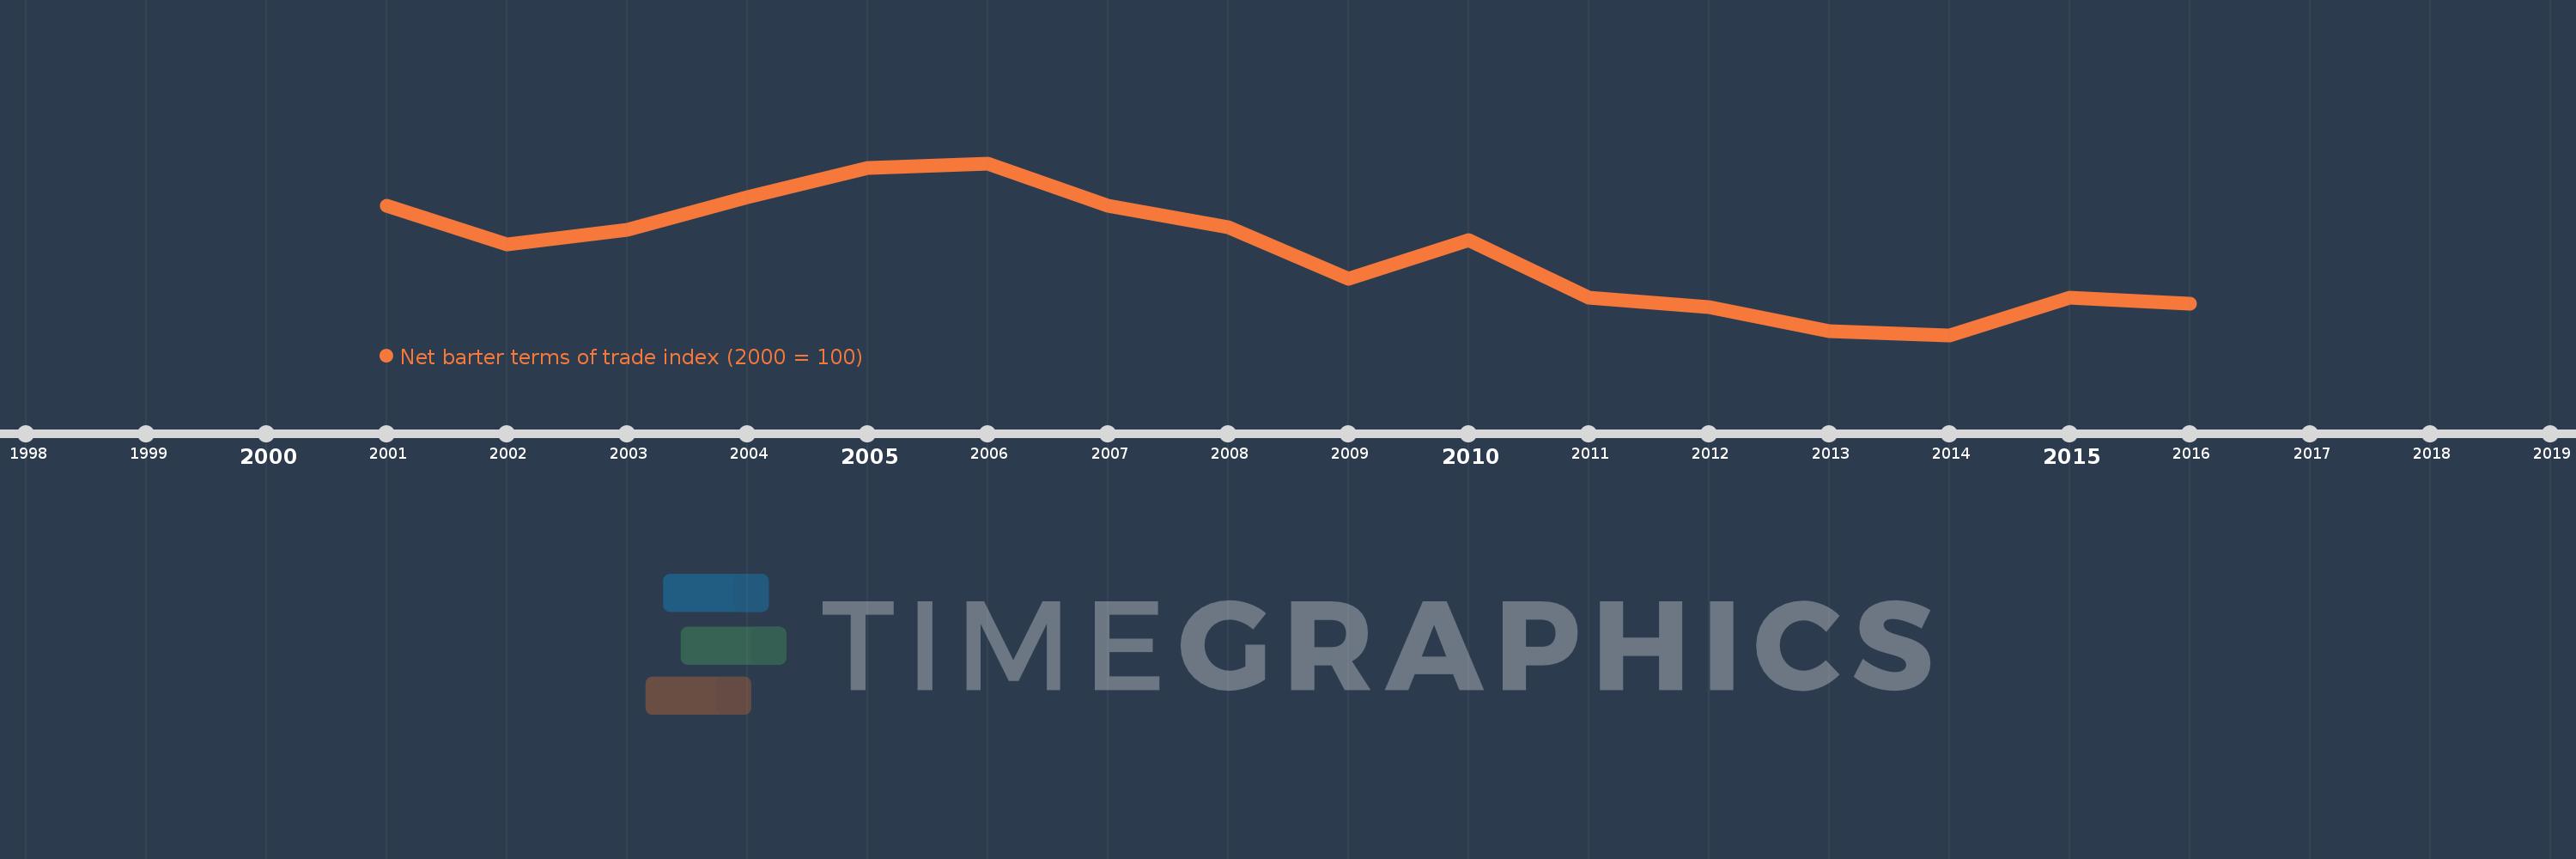
This timeline shows a graph from 2001 to 2016 of Slovak Republic. No data until 2000. Number of actual observations by date: 16.
Source name:
World Development Indicators
Source organization:
United Nations Conference on Trade and Development, Handbook of Statistics and data files, and International Monetary Fund, International Financial Statistics.
Categories, topics:
Private Sector, Trade
Last updated:
apr 23, 2017
Indicators value changes by year
Meaning:
96.792
Minimum:
91.009
jan 1, 2014
Maximum:
102.983
jan 1, 2006
At the date of observation
Value
Absolute change
Change from the previous value
jan 1, 2001
100.0
+100.0
0.0%
jan 1, 2002
97.316
-2.684
-2.68%
jan 1, 2003
98.351
+1.035
1.06%
jan 1, 2004
100.602
+2.251
2.29%
jan 1, 2005
102.673
+2.071
2.06%
jan 1, 2006
102.983
+0.31
0.3%
jan 1, 2007
100.008
-2.975
-2.89%
jan 1, 2008
98.496
-1.512
-1.51%
jan 1, 2009
94.93
-3.567
-3.62%
jan 1, 2010
97.607
+2.677
2.82%
jan 1, 2011
93.64
-3.968
-4.07%
jan 1, 2012
92.933
-0.707
-0.75%
jan 1, 2013
91.301
-1.632
-1.76%
jan 1, 2014
91.009
-0.292
-0.32%
jan 1, 2015
93.64
+2.63
2.89%
jan 1, 2016
93.185
-0.455
-0.49%
Ranking of countries by current statistics by years