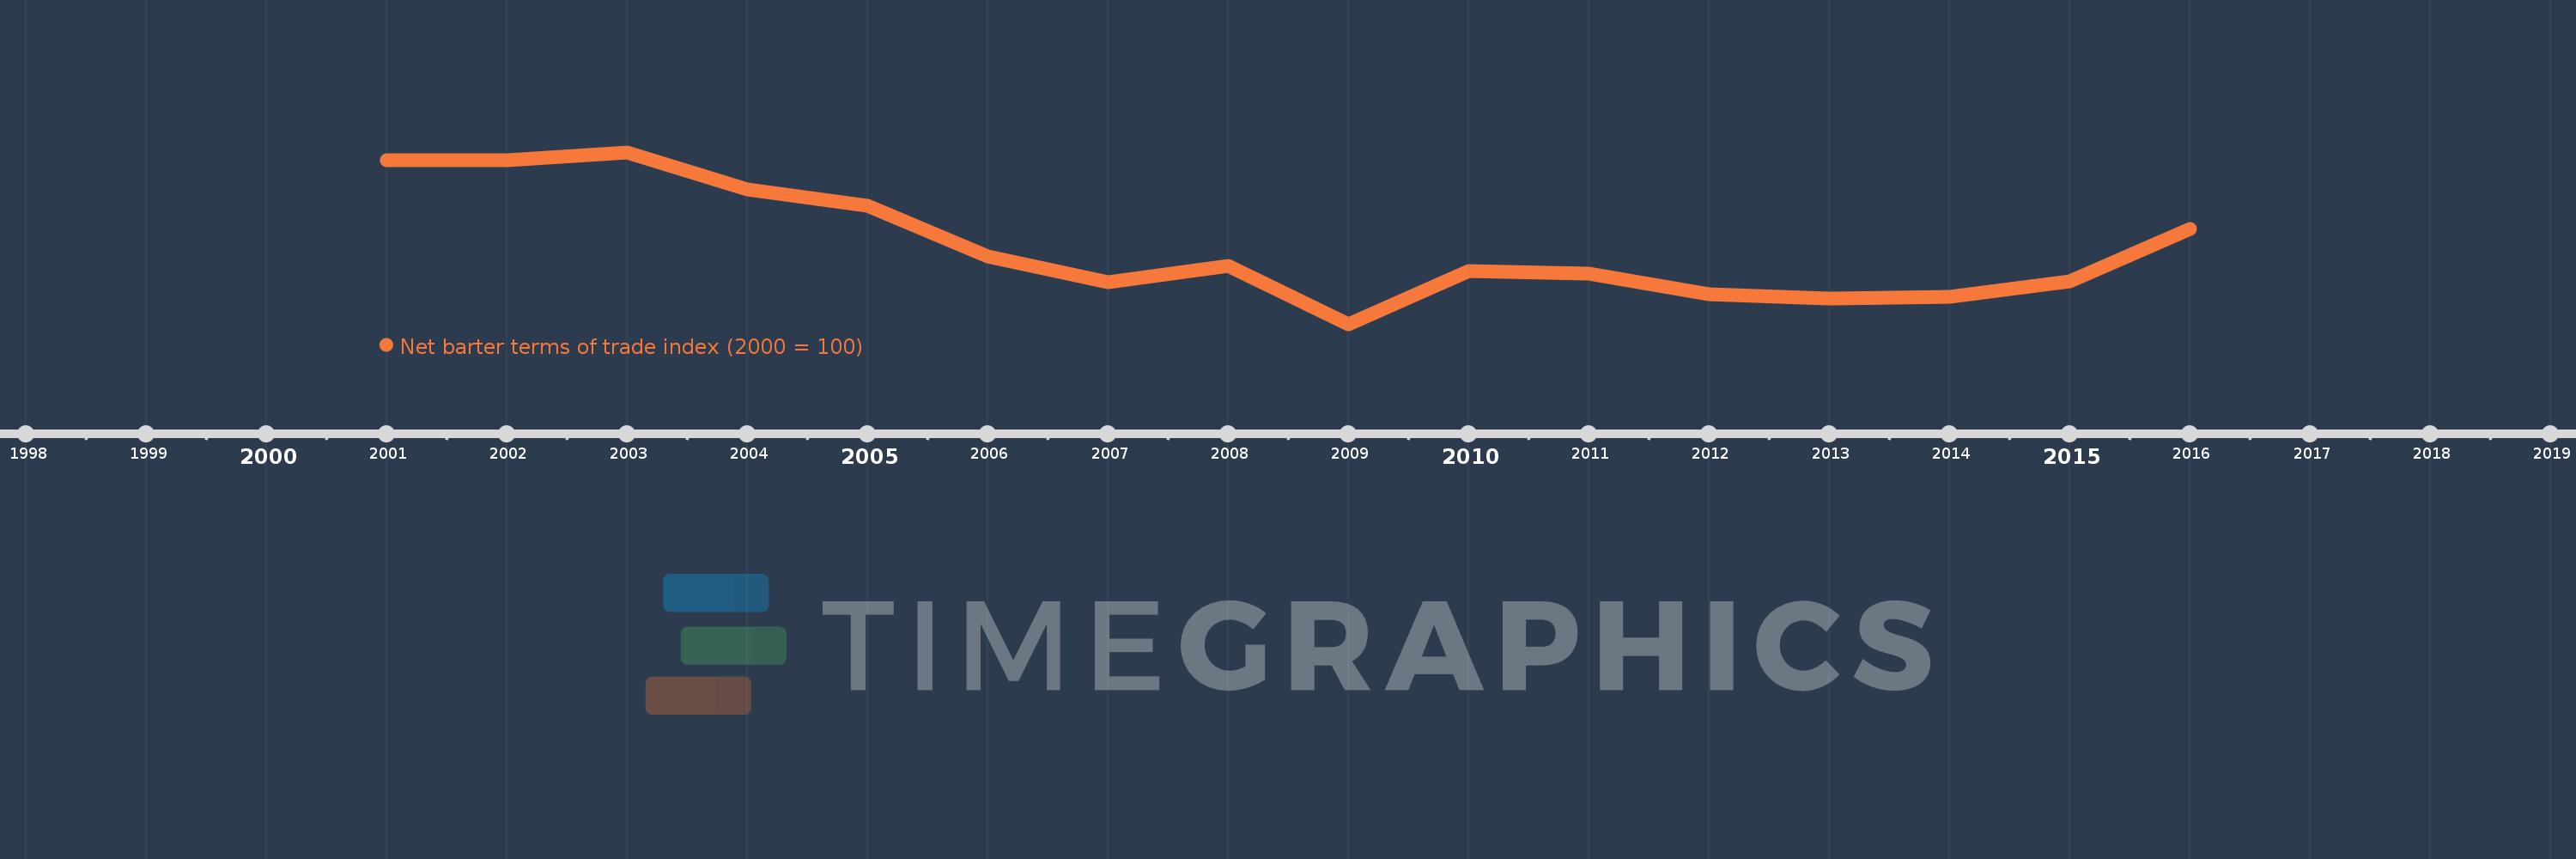
This timeline shows a graph from 2001 to 2016 of West Bank and Gaza. No data until 2000. Number of actual observations by date: 16.
Source name:
World Development Indicators
Source organization:
United Nations Conference on Trade and Development, Handbook of Statistics and data files, and International Monetary Fund, International Financial Statistics.
Categories, topics:
Private Sector, Trade
Last updated:
apr 23, 2017
Indicators value changes by year
Meaning:
83.493
Minimum:
68.625
jan 1, 2009
Maximum:
101.456
jan 1, 2003
At the date of observation
Value
Absolute change
Change from the previous value
jan 1, 2001
100.0
+100.0
0.0%
jan 1, 2002
99.938
-0.062
-0.06%
jan 1, 2003
101.456
+1.518
1.52%
jan 1, 2004
94.39
-7.065
-6.96%
jan 1, 2005
91.197
-3.193
-3.38%
jan 1, 2006
81.505
-9.692
-10.63%
jan 1, 2007
76.637
-4.867
-5.97%
jan 1, 2008
79.755
+3.118
4.07%
jan 1, 2009
68.625
-11.131
-13.96%
jan 1, 2010
78.732
+10.108
14.73%
jan 1, 2011
78.305
-0.428
-0.54%
jan 1, 2012
74.342
-3.962
-5.06%
jan 1, 2013
73.59
-0.753
-1.01%
jan 1, 2014
73.826
+0.236
0.32%
jan 1, 2015
76.827
+3.001
4.06%
jan 1, 2016
86.763
+9.936
12.93%
Ranking of countries by current statistics by years