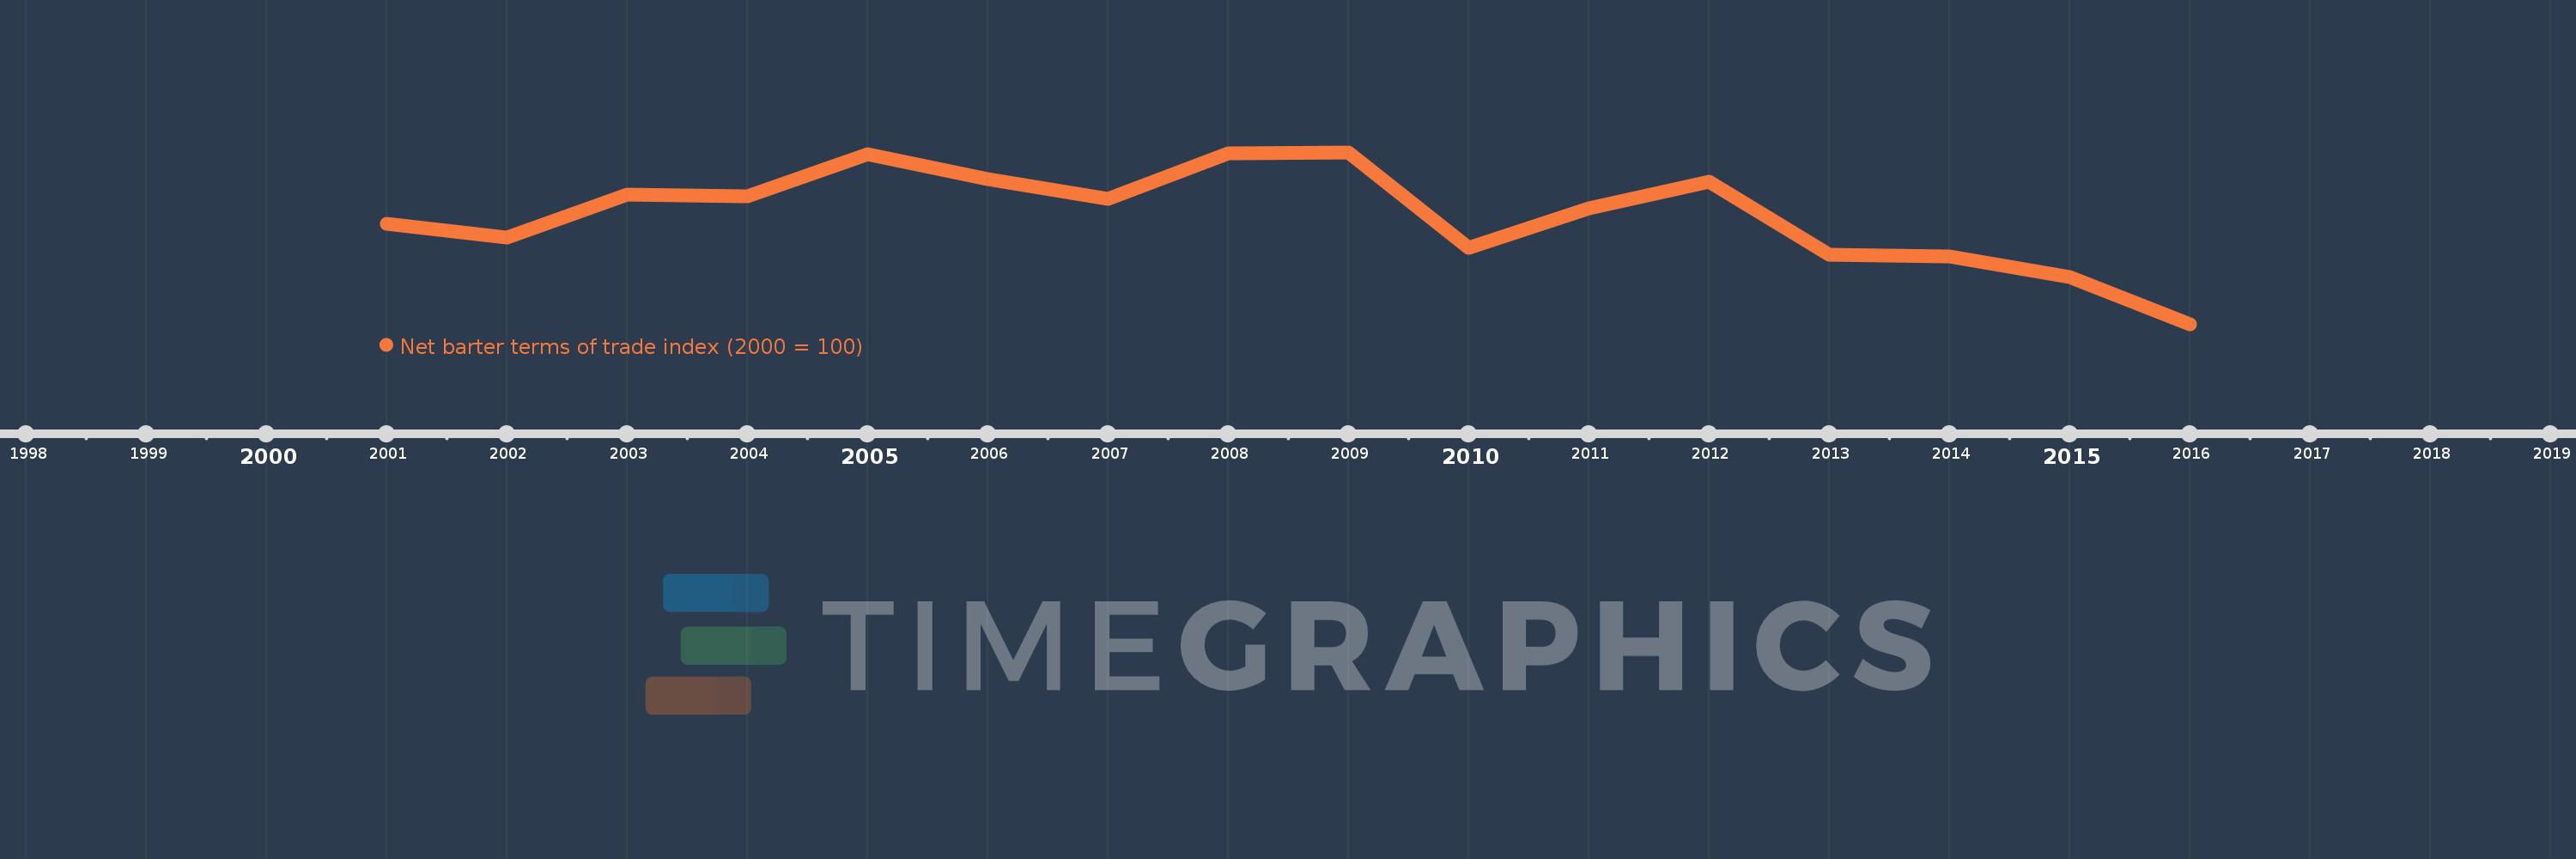
This timeline shows a graph from 2001 to 2016 of Ukraine. No data until 2000. Number of actual observations by date: 16.
Source name:
World Development Indicators
Source organization:
United Nations Conference on Trade and Development, Handbook of Statistics and data files, and International Monetary Fund, International Financial Statistics.
Categories, topics:
Private Sector, Trade
Last updated:
apr 23, 2017
Indicators value changes by year
Meaning:
101.369
Minimum:
83.704
jan 1, 2016
Maximum:
111.51
jan 1, 2009
At the date of observation
Value
Absolute change
Change from the previous value
jan 1, 2001
100.0
+100.0
0.0%
jan 1, 2002
97.684
-2.316
-2.32%
jan 1, 2003
104.661
+6.977
7.14%
jan 1, 2004
104.379
-0.283
-0.27%
jan 1, 2005
111.202
+6.823
6.54%
jan 1, 2006
107.213
-3.988
-3.59%
jan 1, 2007
104.017
-3.196
-2.98%
jan 1, 2008
111.329
+7.311
7.03%
jan 1, 2009
111.51
+0.181
0.16%
jan 1, 2010
96.03
-15.48
-13.88%
jan 1, 2011
102.454
+6.424
6.69%
jan 1, 2012
106.701
+4.248
4.15%
jan 1, 2013
94.985
-11.716
-10.98%
jan 1, 2014
94.704
-0.281
-0.3%
jan 1, 2015
91.332
-3.372
-3.56%
jan 1, 2016
83.704
-7.628
-8.35%
Ranking of countries by current statistics by years