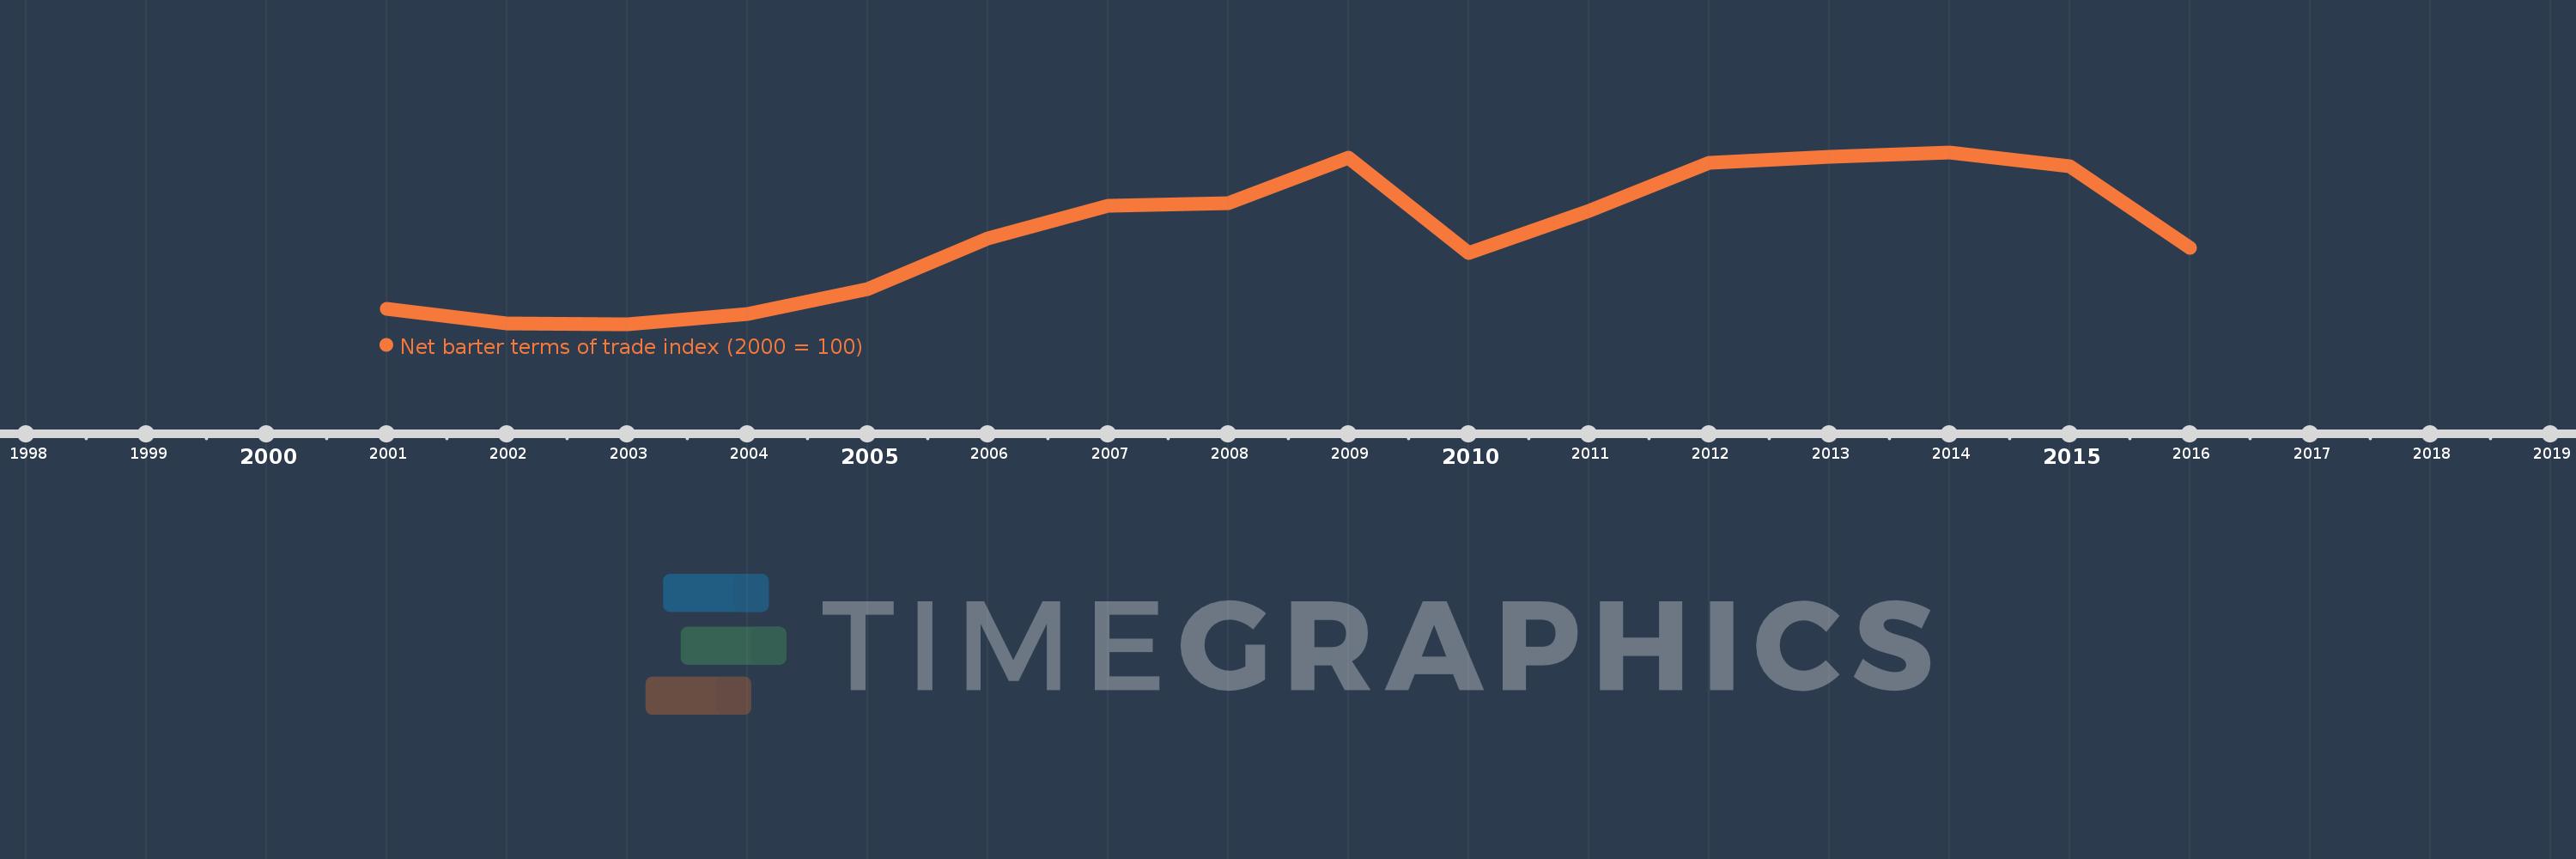
This timeline shows a graph from 2001 to 2016 of Iran, Islamic Rep.. No data until 2000. Number of actual observations by date: 16.
Source name:
World Development Indicators
Source organization:
United Nations Conference on Trade and Development, Handbook of Statistics and data files, and International Monetary Fund, International Financial Statistics.
Categories, topics:
Private Sector, Trade
Last updated:
apr 23, 2017
Indicators value changes by year
Meaning:
144.157
Minimum:
91.088
jan 1, 2003
Maximum:
190.069
jan 1, 2014
At the date of observation
Value
Absolute change
Change from the previous value
jan 1, 2001
100.0
+100.0
0.0%
jan 1, 2002
91.773
-8.227
-8.23%
jan 1, 2003
91.088
-0.685
-0.75%
jan 1, 2004
96.957
+5.869
6.44%
jan 1, 2005
111.497
+14.54
15.0%
jan 1, 2006
140.769
+29.272
26.25%
jan 1, 2007
159.223
+18.454
13.11%
jan 1, 2008
160.693
+1.47
0.92%
jan 1, 2009
187.104
+26.411
16.44%
jan 1, 2010
132.134
-54.97
-29.38%
jan 1, 2011
156.384
+24.25
18.35%
jan 1, 2012
183.973
+27.589
17.64%
jan 1, 2013
187.533
+3.56
1.94%
jan 1, 2014
190.069
+2.536
1.35%
jan 1, 2015
182.089
-7.981
-4.2%
jan 1, 2016
135.227
-46.862
-25.74%
Ranking of countries by current statistics by years