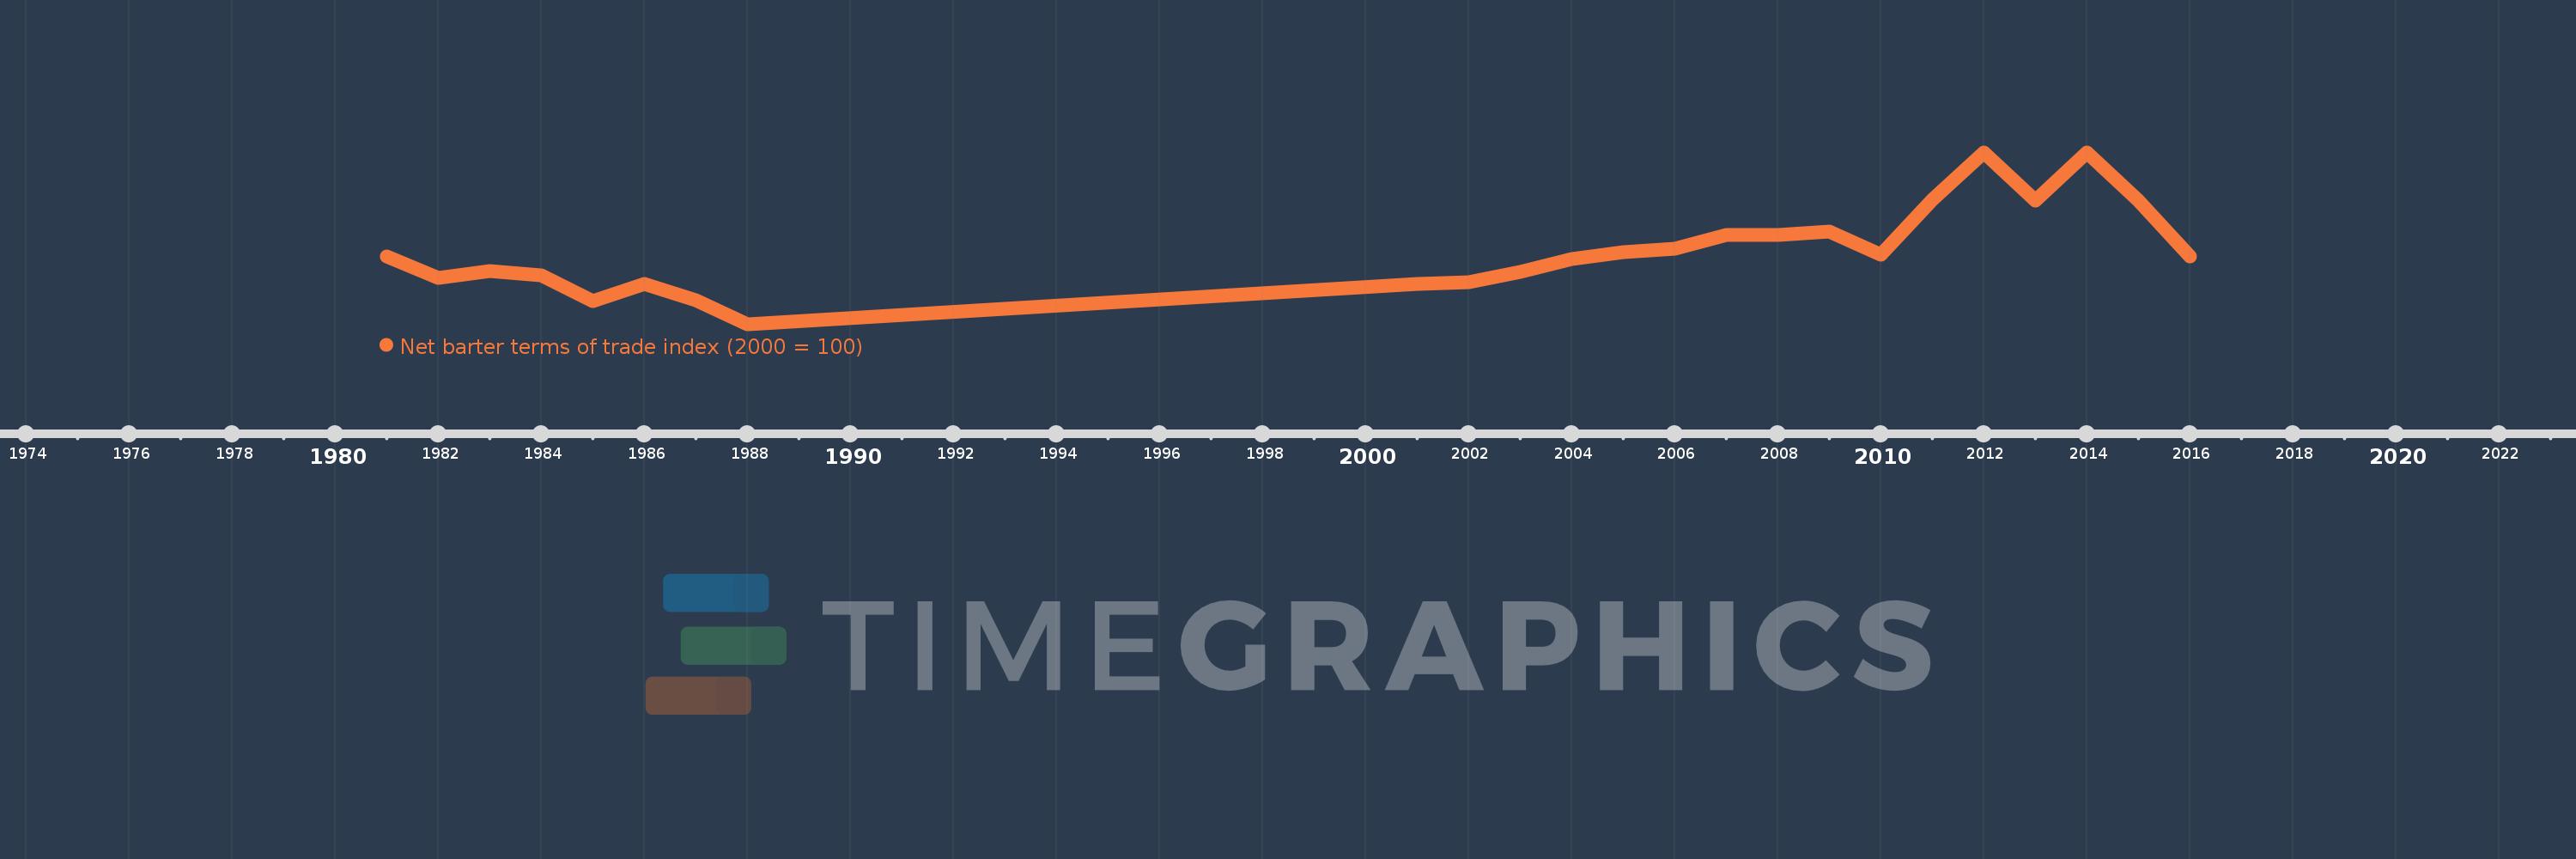
This timeline shows a graph from 1981 to 2016 of Liberia. No data until 1980. Number of actual observations by date: 24.
Source name:
World Development Indicators
Source organization:
United Nations Conference on Trade and Development, Handbook of Statistics and data files, and International Monetary Fund, International Financial Statistics.
Categories, topics:
Private Sector, Trade
Last updated:
apr 23, 2017
Indicators value changes by year
Meaning:
113.507
Minimum:
83.909
jan 1, 1988
Maximum:
152.695
jan 1, 2012
At the date of observation
Value
Absolute change
Change from the previous value
jan 1, 1981
111.025
+111.025
0.0%
jan 1, 1982
102.314
-8.711
-7.85%
jan 1, 1983
105.226
+2.912
2.85%
jan 1, 1984
103.333
-1.892
-1.8%
jan 1, 1985
93.174
-10.16
-9.83%
jan 1, 1986
100.0
+6.826
7.33%
jan 1, 1987
93.5
-6.5
-6.5%
jan 1, 1988
83.909
-9.592
-10.26%
jan 1, 2001
100.0
+16.091
19.18%
jan 1, 2002
100.766
+0.766
0.77%
jan 1, 2003
104.735
+3.969
3.94%
jan 1, 2004
110.032
+5.297
5.06%
jan 1, 2005
112.634
+2.602
2.36%
jan 1, 2006
114.304
+1.67
1.48%
jan 1, 2007
119.759
+5.454
4.77%
jan 1, 2008
119.655
-0.103
-0.09%
jan 1, 2009
121.156
+1.5
1.25%
jan 1, 2010
111.717
-9.439
-7.79%
jan 1, 2011
133.704
+21.988
19.68%
jan 1, 2012
152.695
+18.99
14.2%
jan 1, 2013
133.359
-19.335
-12.66%
jan 1, 2014
152.595
+19.235
14.42%
jan 1, 2015
133.57
-19.025
-12.47%
jan 1, 2016
111.012
-22.558
-16.89%
Ranking of countries by current statistics by years