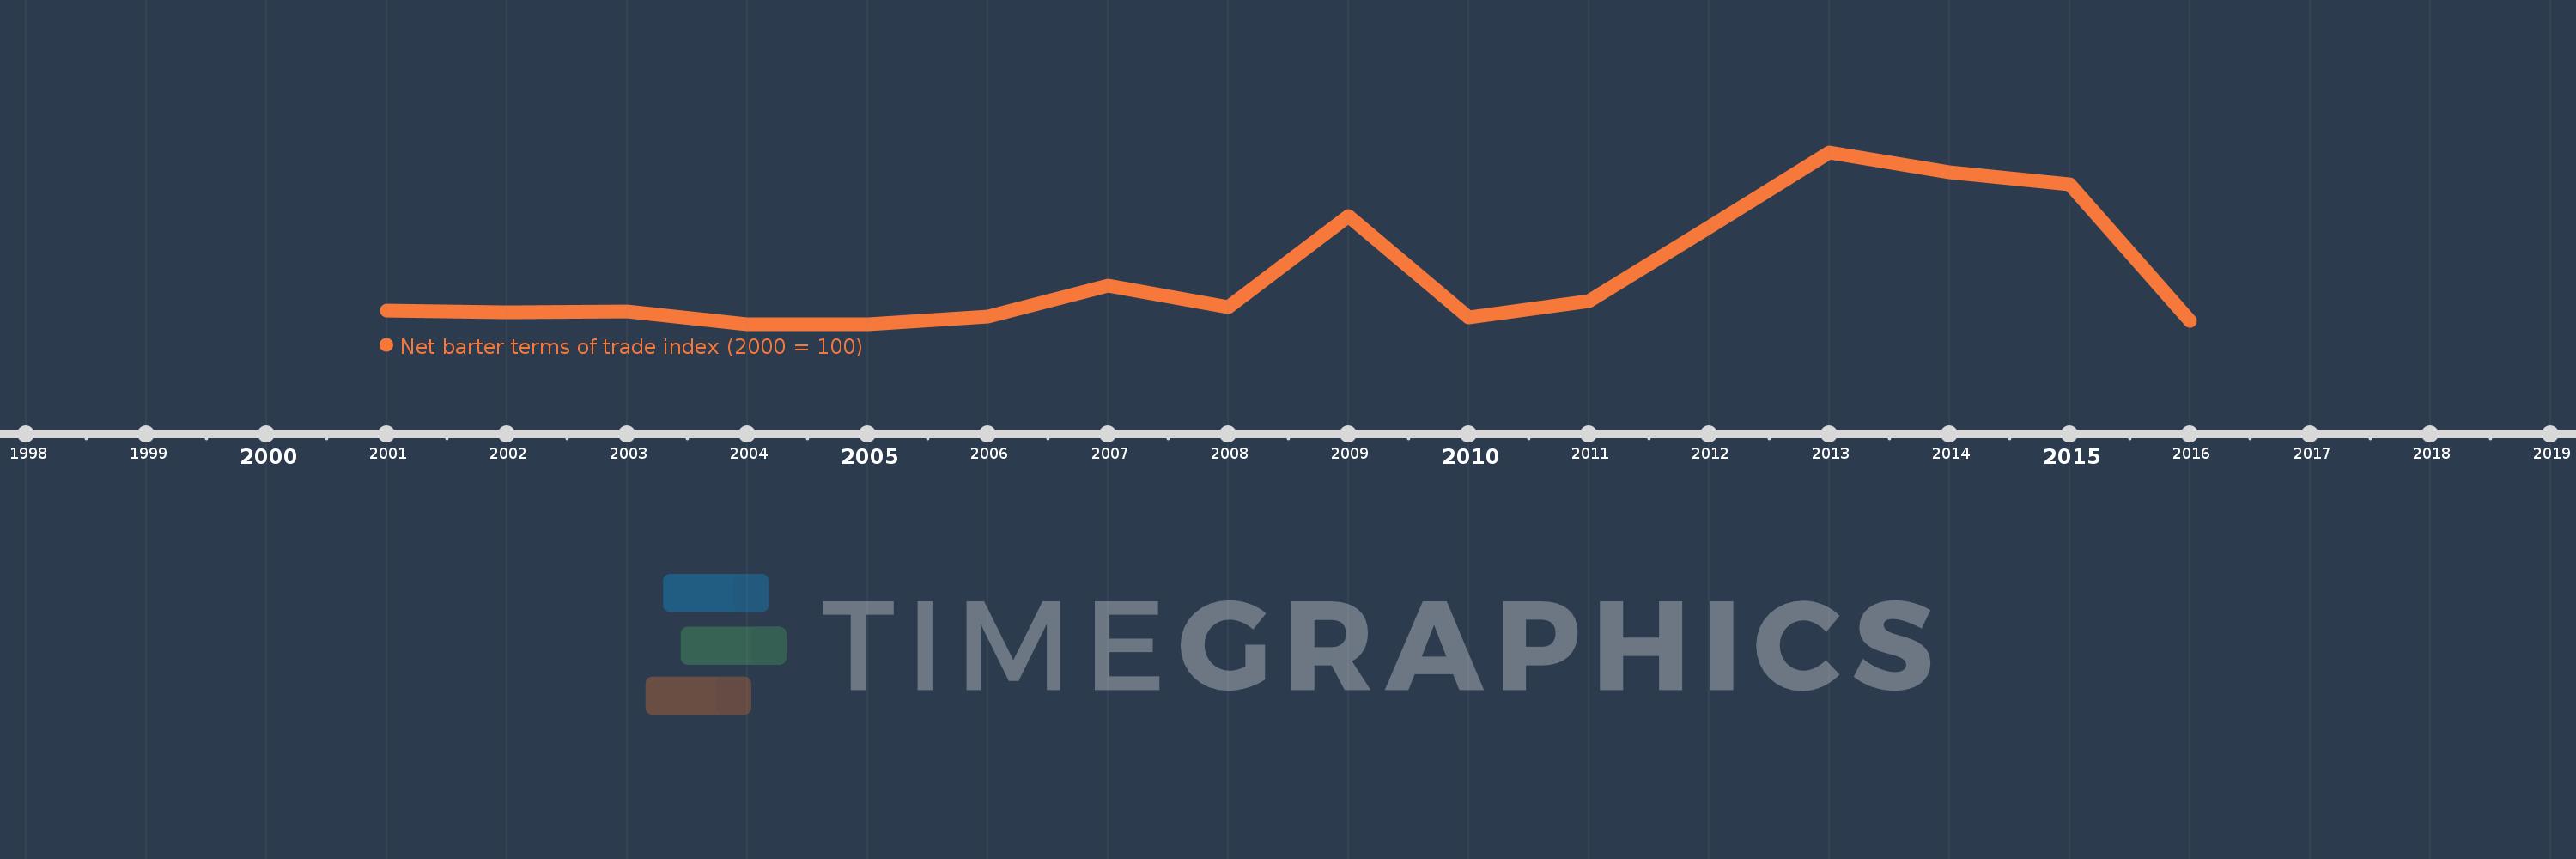
This timeline shows a graph from 2001 to 2016 of Belarus. No data until 2000. Number of actual observations by date: 16.
Source name:
World Development Indicators
Source organization:
United Nations Conference on Trade and Development, Handbook of Statistics and data files, and International Monetary Fund, International Financial Statistics.
Categories, topics:
Private Sector, Trade
Last updated:
apr 23, 2017
Indicators value changes by year
Meaning:
104.472
Minimum:
98.364
jan 1, 2004
Maximum:
119.274
jan 1, 2013
At the date of observation
Value
Absolute change
Change from the previous value
jan 1, 2001
100.0
+100.0
0.0%
jan 1, 2002
99.793
-0.207
-0.21%
jan 1, 2003
99.895
+0.102
0.1%
jan 1, 2004
98.364
-1.531
-1.53%
jan 1, 2005
98.364
0.0
0.0%
jan 1, 2006
99.276
+0.912
0.93%
jan 1, 2007
103.07
+3.794
3.82%
jan 1, 2008
100.489
-2.581
-2.5%
jan 1, 2009
111.534
+11.045
10.99%
jan 1, 2010
99.171
-12.363
-11.08%
jan 1, 2011
101.188
+2.017
2.03%
jan 1, 2012
110.127
+8.939
8.83%
jan 1, 2013
119.274
+9.148
8.31%
jan 1, 2014
116.886
-2.388
-2.0%
jan 1, 2015
115.402
-1.484
-1.27%
jan 1, 2016
98.721
-16.681
-14.45%
Ranking of countries by current statistics by years