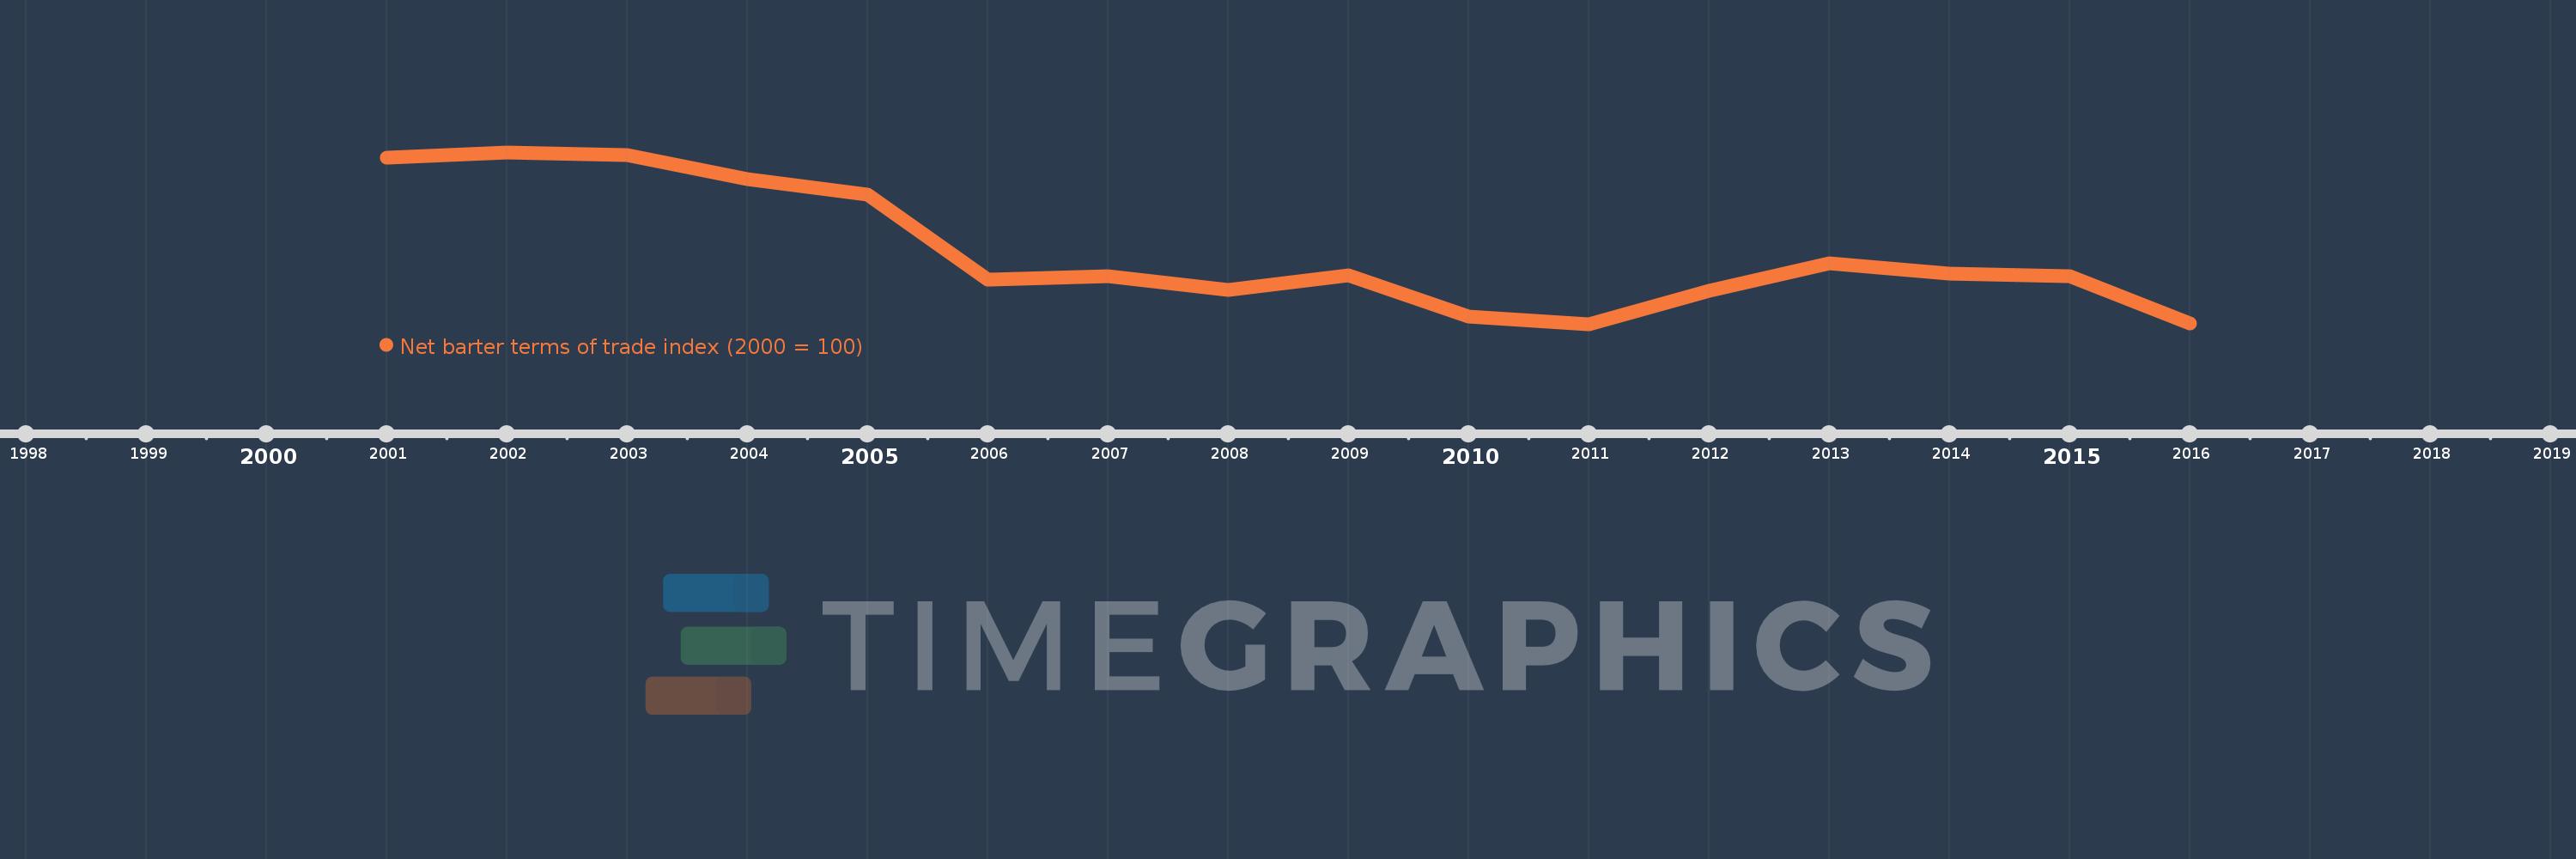
This timeline shows a graph from 2001 to 2016 of Djibouti. No data until 2000. Number of actual observations by date: 16.
Source name:
World Development Indicators
Source organization:
United Nations Conference on Trade and Development, Handbook of Statistics and data files, and International Monetary Fund, International Financial Statistics.
Categories, topics:
Private Sector, Trade
Last updated:
apr 23, 2017
Indicators value changes by year
Meaning:
88.916
Minimum:
80.422
jan 1, 2011
Maximum:
100.567
jan 1, 2002
At the date of observation
Value
Absolute change
Change from the previous value
jan 1, 2001
100.0
+100.0
0.0%
jan 1, 2002
100.567
+0.567
0.57%
jan 1, 2003
100.239
-0.328
-0.33%
jan 1, 2004
97.482
-2.757
-2.75%
jan 1, 2005
95.654
-1.828
-1.87%
jan 1, 2006
85.654
-10.0
-10.45%
jan 1, 2007
86.019
+0.365
0.43%
jan 1, 2008
84.439
-1.58
-1.84%
jan 1, 2009
86.122
+1.683
1.99%
jan 1, 2010
81.277
-4.845
-5.63%
jan 1, 2011
80.422
-0.854
-1.05%
jan 1, 2012
84.327
+3.904
4.85%
jan 1, 2013
87.59
+3.264
3.87%
jan 1, 2014
86.307
-1.283
-1.47%
jan 1, 2015
86.086
-0.221
-0.26%
jan 1, 2016
80.466
-5.62
-6.53%
Ranking of countries by current statistics by years