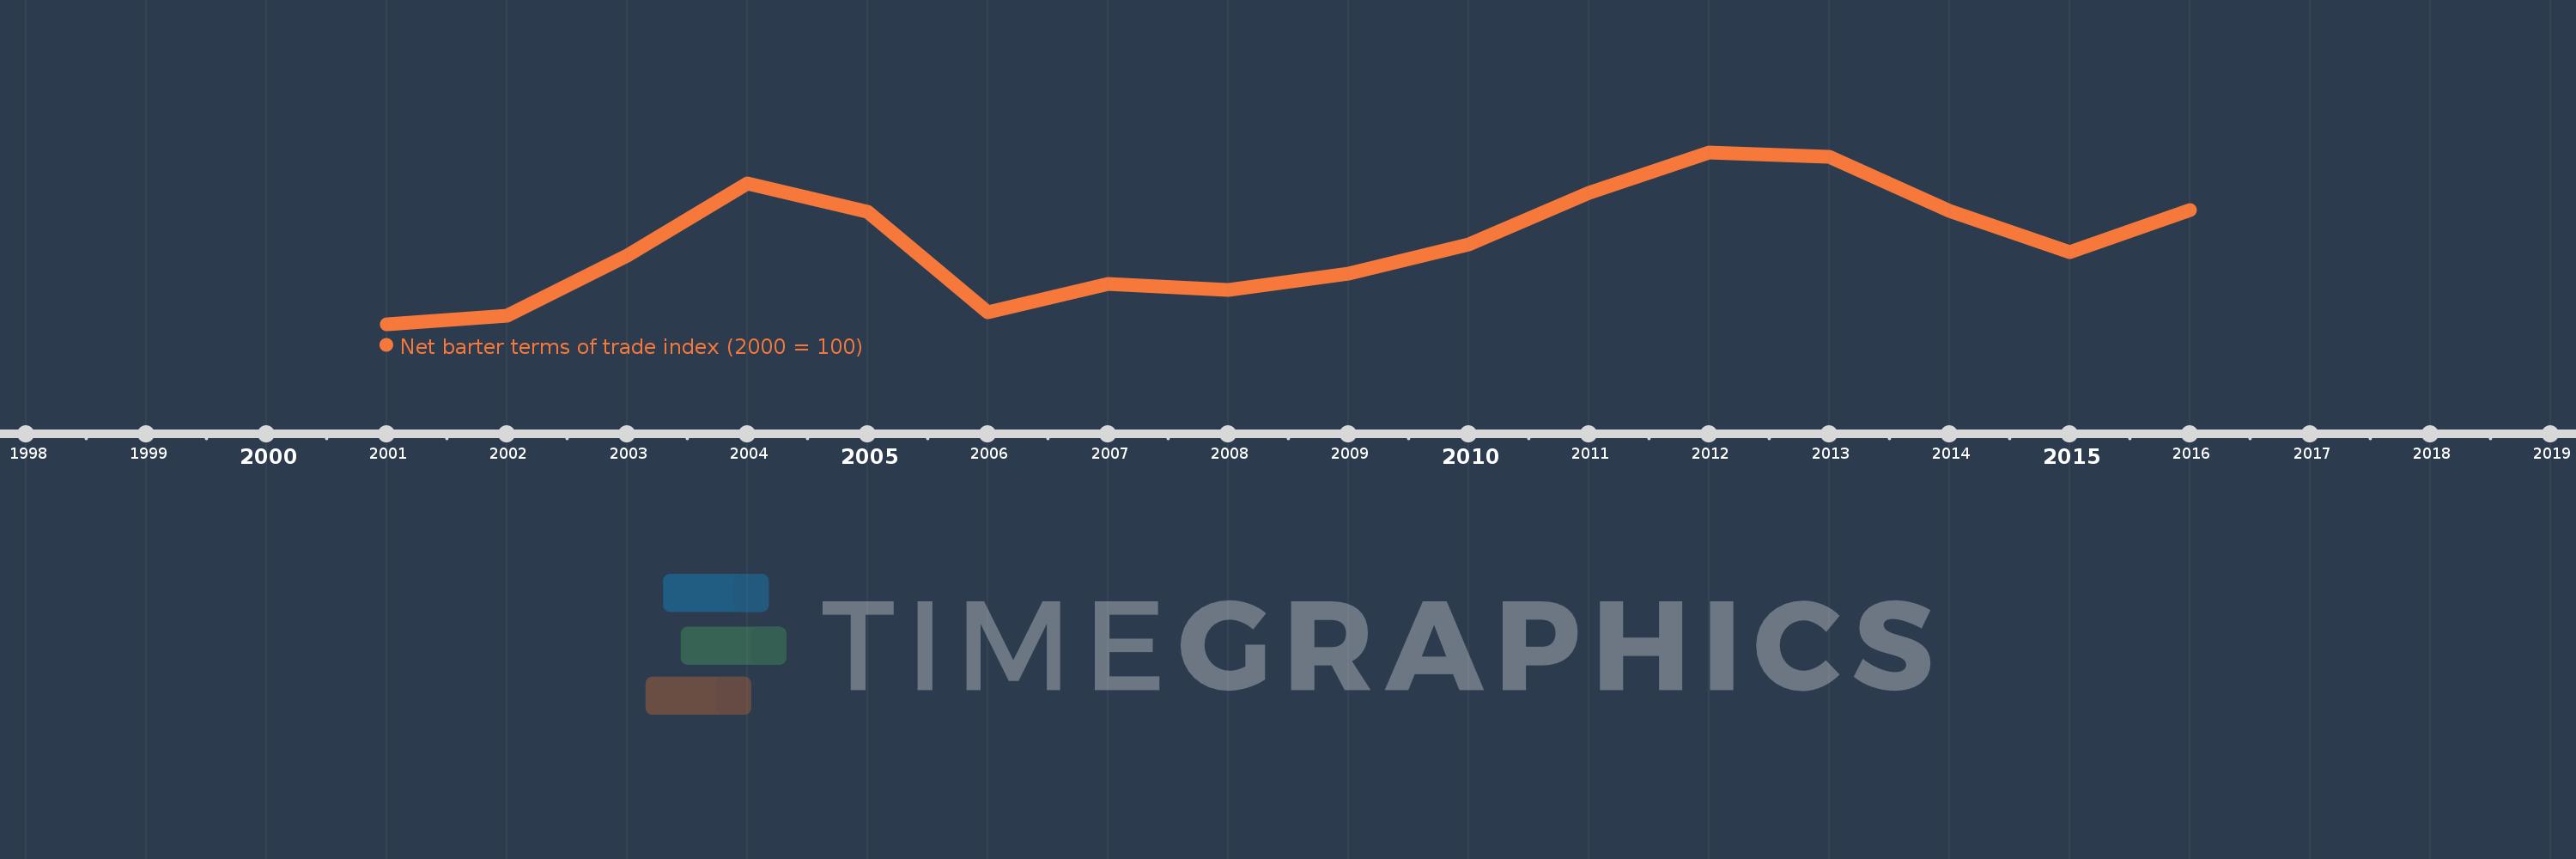
This timeline shows a graph from 2001 to 2016 of Kyrgyz Republic. No data until 2000. Number of actual observations by date: 16.
Source name:
World Development Indicators
Source organization:
United Nations Conference on Trade and Development, Handbook of Statistics and data files, and International Monetary Fund, International Financial Statistics.
Categories, topics:
Private Sector, Trade
Last updated:
apr 23, 2017
Indicators value changes by year
Meaning:
106.246
Minimum:
100.0
jan 1, 2001
Maximum:
113.03
jan 1, 2012
At the date of observation
Value
Absolute change
Change from the previous value
jan 1, 2001
100.0
+100.0
0.0%
jan 1, 2002
100.619
+0.619
0.62%
jan 1, 2003
105.214
+4.594
4.57%
jan 1, 2004
110.673
+5.459
5.19%
jan 1, 2005
108.553
-2.12
-1.92%
jan 1, 2006
100.883
-7.67
-7.07%
jan 1, 2007
103.084
+2.201
2.18%
jan 1, 2008
102.606
-0.477
-0.46%
jan 1, 2009
103.828
+1.221
1.19%
jan 1, 2010
106.066
+2.238
2.16%
jan 1, 2011
109.967
+3.901
3.68%
jan 1, 2012
113.03
+3.063
2.79%
jan 1, 2013
112.699
-0.33
-0.29%
jan 1, 2014
108.576
-4.123
-3.66%
jan 1, 2015
105.443
-3.133
-2.89%
jan 1, 2016
108.691
+3.248
3.08%
Ranking of countries by current statistics by years