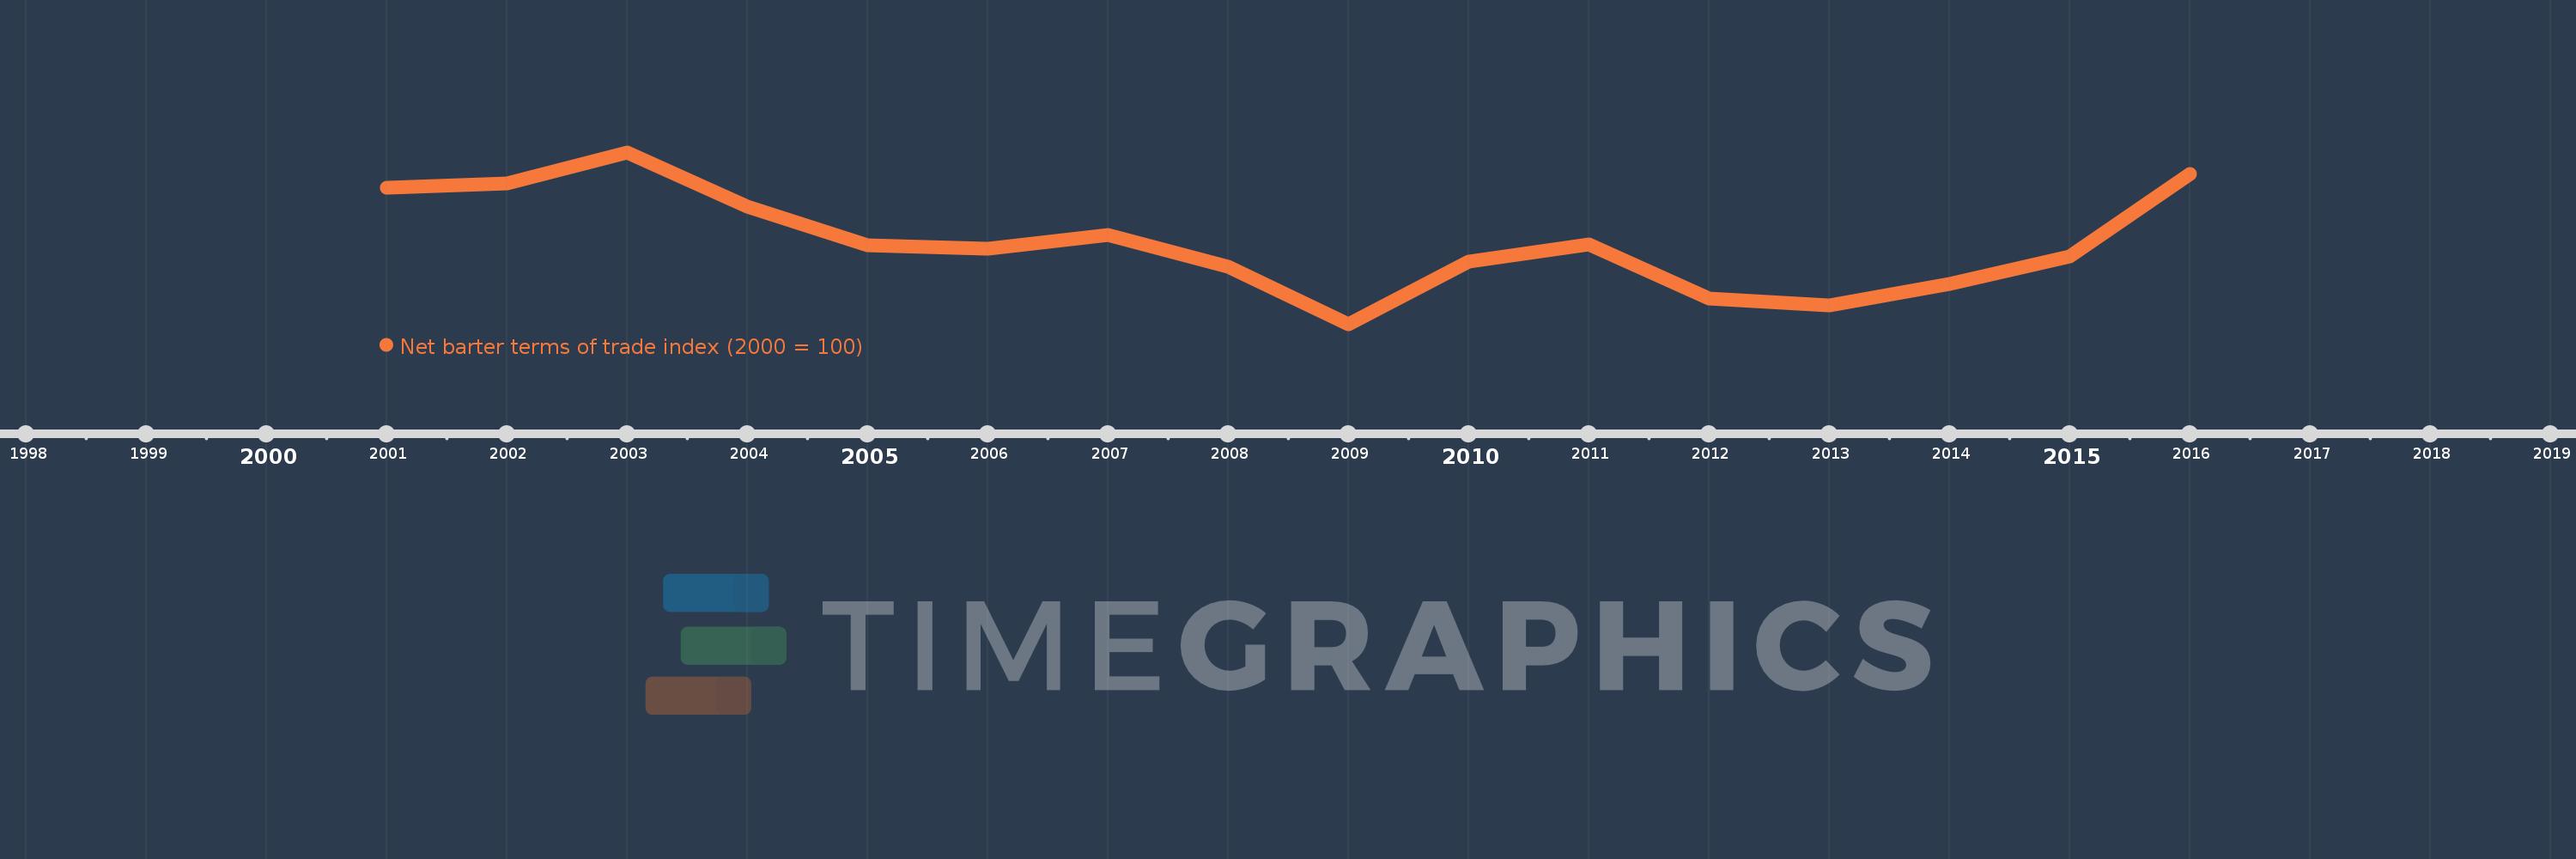
This timeline shows a graph from 2001 to 2016 of Maldives. No data until 2000. Number of actual observations by date: 16.
Source name:
World Development Indicators
Source organization:
United Nations Conference on Trade and Development, Handbook of Statistics and data files, and International Monetary Fund, International Financial Statistics.
Categories, topics:
Private Sector, Trade
Last updated:
apr 23, 2017
Indicators value changes by year
Meaning:
93.518
Minimum:
83.684
jan 1, 2009
Maximum:
104.279
jan 1, 2003
At the date of observation
Value
Absolute change
Change from the previous value
jan 1, 2001
100.0
+100.0
0.0%
jan 1, 2002
100.577
+0.577
0.58%
jan 1, 2003
104.279
+3.703
3.68%
jan 1, 2004
97.78
-6.499
-6.23%
jan 1, 2005
93.109
-4.671
-4.78%
jan 1, 2006
92.742
-0.367
-0.39%
jan 1, 2007
94.337
+1.595
1.72%
jan 1, 2008
90.587
-3.75
-3.98%
jan 1, 2009
83.684
-6.903
-7.62%
jan 1, 2010
91.142
+7.458
8.91%
jan 1, 2011
93.244
+2.103
2.31%
jan 1, 2012
86.789
-6.455
-6.92%
jan 1, 2013
85.96
-0.829
-0.96%
jan 1, 2014
88.552
+2.592
3.02%
jan 1, 2015
91.842
+3.29
3.72%
jan 1, 2016
101.666
+9.824
10.7%
Ranking of countries by current statistics by years