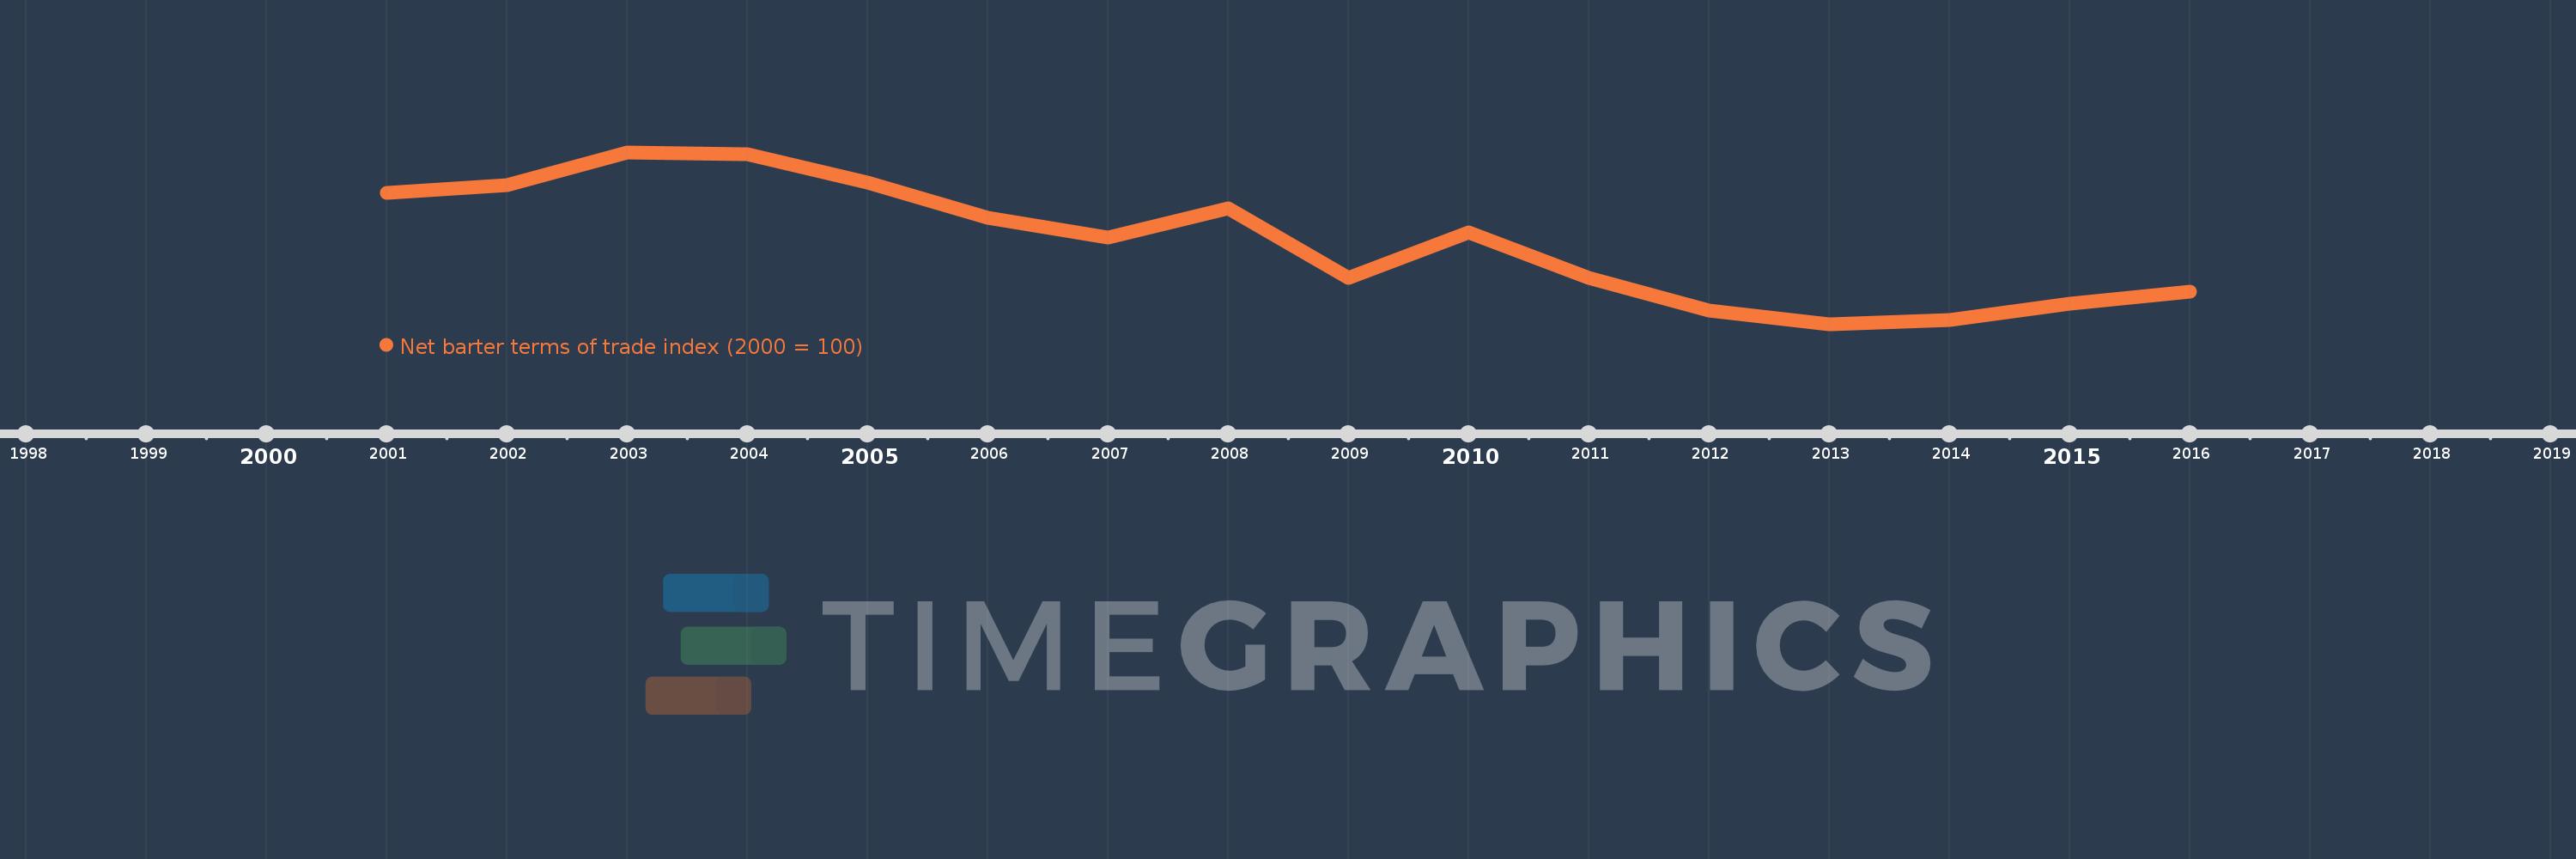
This timeline shows a graph from 2001 to 2016 of Belgium. No data until 2000. Number of actual observations by date: 16.
Source name:
World Development Indicators
Source organization:
United Nations Conference on Trade and Development, Handbook of Statistics and data files, and International Monetary Fund, International Financial Statistics.
Categories, topics:
Private Sector, Trade
Last updated:
apr 23, 2017
Indicators value changes by year
Meaning:
97.963
Minimum:
94.562
jan 1, 2013
Maximum:
101.657
jan 1, 2003
At the date of observation
Value
Absolute change
Change from the previous value
jan 1, 2001
100.0
+100.0
0.0%
jan 1, 2002
100.298
+0.298
0.3%
jan 1, 2003
101.657
+1.36
1.36%
jan 1, 2004
101.596
-0.062
-0.06%
jan 1, 2005
100.418
-1.177
-1.16%
jan 1, 2006
98.966
-1.452
-1.45%
jan 1, 2007
98.127
-0.839
-0.85%
jan 1, 2008
99.342
+1.215
1.24%
jan 1, 2009
96.462
-2.879
-2.9%
jan 1, 2010
98.35
+1.887
1.96%
jan 1, 2011
96.462
-1.887
-1.92%
jan 1, 2012
95.127
-1.335
-1.38%
jan 1, 2013
94.562
-0.565
-0.59%
jan 1, 2014
94.719
+0.157
0.17%
jan 1, 2015
95.395
+0.676
0.71%
jan 1, 2016
95.922
+0.526
0.55%
Ranking of countries by current statistics by years